- Home >
- Stock Photos >
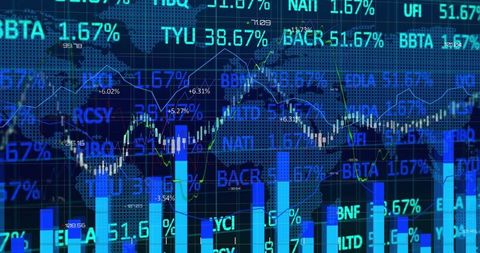
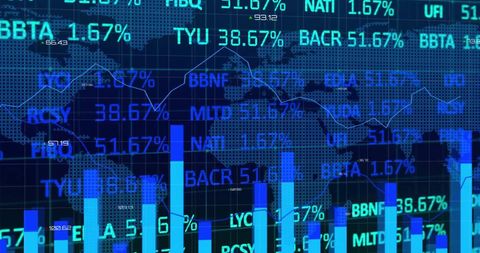
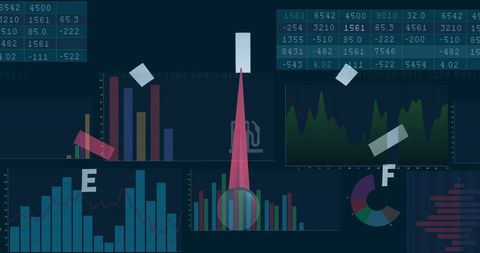
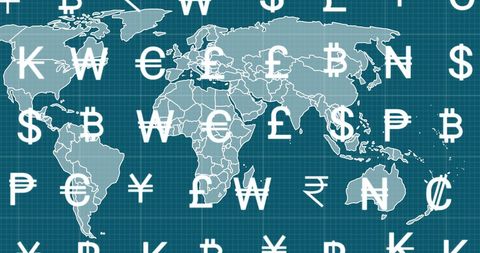
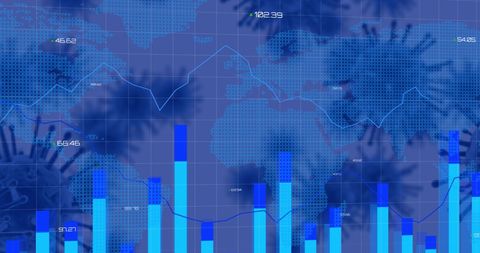
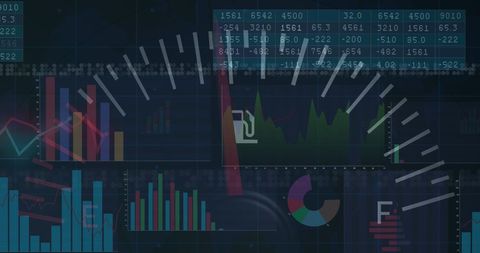
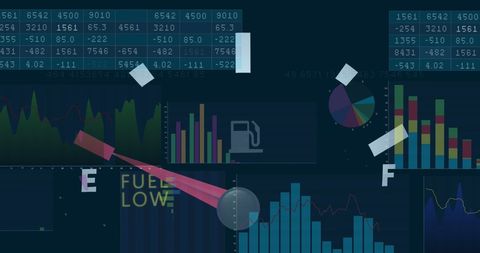
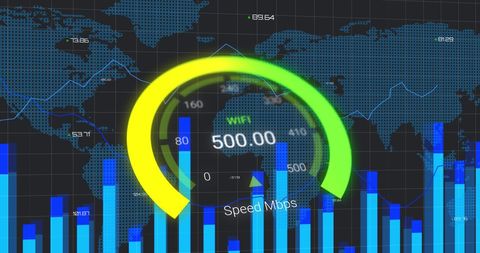
- Global Financial Data Analysis with World Map and Bar Graphs
Global Financial Data Analysis with World Map and Bar Graphs Image
Visual depicting financial analysis with bar graphs overlaying a world map. Useful for illustrating topics related to global finance, economic trends, business analytics, trade statistics, and data-driven decision-making strategies.
Powered by 


Credit Photo
If you would like to credit the Photo, here are some ways you can do so
Text Link
photo Link
<span class="text-link">
<span>
<a target="_blank" href=https://pikwizard.com/photo/global-financial-data-analysis-with-world-map-and-bar-graphs/00ac8dba69624307597133e3c44e8429/>PikWizard</a>
</span>
</span>
<span class="image-link">
<span
style="margin: 0 0 20px 0; display: inline-block; vertical-align: middle; width: 100%;"
>
<a
target="_blank"
href="https://pikwizard.com/photo/global-financial-data-analysis-with-world-map-and-bar-graphs/00ac8dba69624307597133e3c44e8429/"
style="text-decoration: none; font-size: 10px; margin: 0;"
>
<img src="https://pikwizard.com/pw/medium/00ac8dba69624307597133e3c44e8429.jpg" style="margin: 0; width: 100%;" alt="" />
<p style="font-size: 12px; margin: 0;">PikWizard</p>
</a>
</span>
</span>
Free (free of charge)
Free for personal and commercial use.
Author: People Creations
Similar Free Stock Images
Loading...

Premium

Premium
Premium


Premium


Premium


Premium


Premium


Premium


Premium


Premium


Premium


Premium


Premium


Premium


Premium


Premium


Premium


Premium

Premium


Premium


Premium

Premium


Premium


Premium


Premium