- Home >
- Stock Photos >
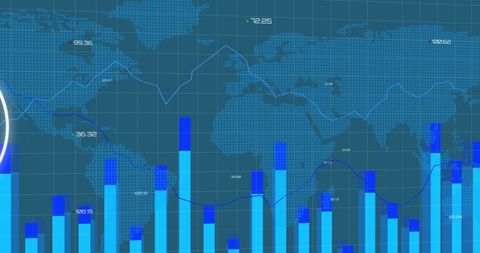
- Global Financial Data Analytics Concept with Blue Graphs
Global Financial Data Analytics Concept with Blue Graphs Image

Visual representation of financial data analytics with bar graphs and world map background displaying business trends and connections. Ideal for illustrating finance and technology topics, enhancing financial presentations or digital business communications.

downloads
Tags:
More
Credit Photo
If you would like to credit the Photo, here are some ways you can do so
Text Link
photo Link
<span class="text-link">
<span>
<a target="_blank" href=https://pikwizard.com/photo/global-financial-data-analytics-concept-with-blue-graphs/00a988386927fcc282df515a02bf4764/>PikWizard</a>
</span>
</span>
<span class="image-link">
<span
style="margin: 0 0 20px 0; display: inline-block; vertical-align: middle; width: 100%;"
>
<a
target="_blank"
href="https://pikwizard.com/photo/global-financial-data-analytics-concept-with-blue-graphs/00a988386927fcc282df515a02bf4764/"
style="text-decoration: none; font-size: 10px; margin: 0;"
>
<img src="https://pikwizard.com/pw/medium/00a988386927fcc282df515a02bf4764.jpg" style="margin: 0; width: 100%;" alt="" />
<p style="font-size: 12px; margin: 0;">PikWizard</p>
</a>
</span>
</span>
Free (free of charge)
Free for personal and commercial use.
Author: People Creations