- Home >
- Stock Photos >
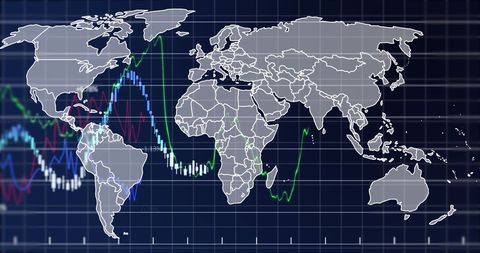
- Global Financial Data Analytics with Graphs on World Map
Global Financial Data Analytics with Graphs on World Map Image

This digital depiction illustrates financial data processing and analysis on a global scale, overlaying complex graphical performance charts over a subtle world map background. The image conveys the interaction of global economic trends and expertise in data analytics. Useful for presentations on global finance, market reports, data science workshops, economic foresight strategies, and investment forecasting materials.

downloads
Tags:
More
Credit Photo
If you would like to credit the Photo, here are some ways you can do so
Text Link
photo Link
<span class="text-link">
<span>
<a target="_blank" href=https://pikwizard.com/photo/global-financial-data-analytics-with-graphs-on-world-map/be3390202b6936b22a46e59c43cbbdc4/>PikWizard</a>
</span>
</span>
<span class="image-link">
<span
style="margin: 0 0 20px 0; display: inline-block; vertical-align: middle; width: 100%;"
>
<a
target="_blank"
href="https://pikwizard.com/photo/global-financial-data-analytics-with-graphs-on-world-map/be3390202b6936b22a46e59c43cbbdc4/"
style="text-decoration: none; font-size: 10px; margin: 0;"
>
<img src="https://pikwizard.com/pw/medium/be3390202b6936b22a46e59c43cbbdc4.jpg" style="margin: 0; width: 100%;" alt="" />
<p style="font-size: 12px; margin: 0;">PikWizard</p>
</a>
</span>
</span>
Free (free of charge)
Free for personal and commercial use.
Author: Authentic Images