- Home >
- Stock Photos >
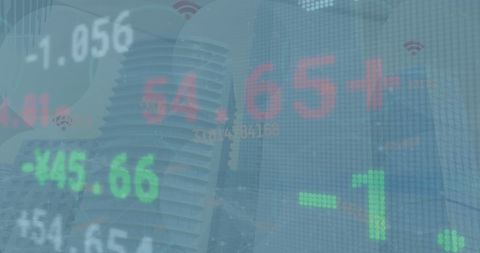
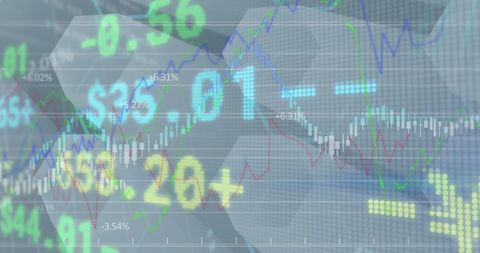
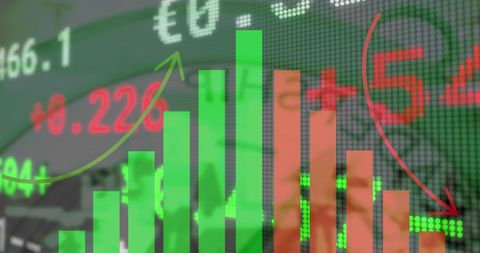
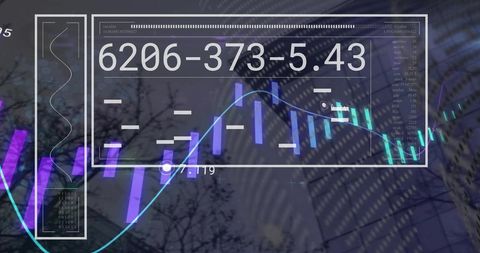
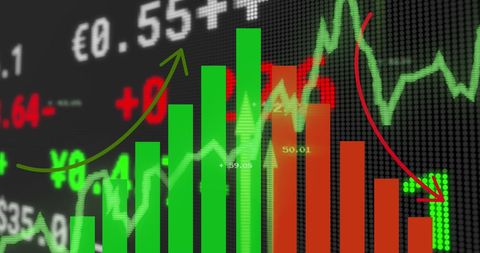
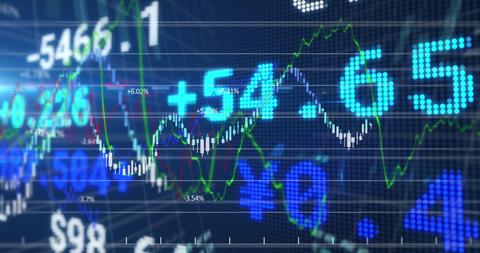
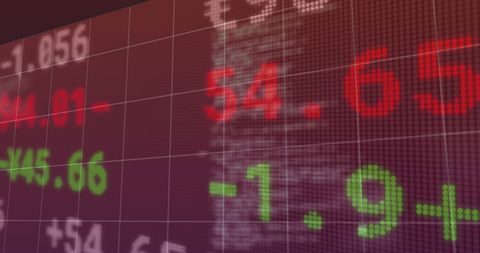
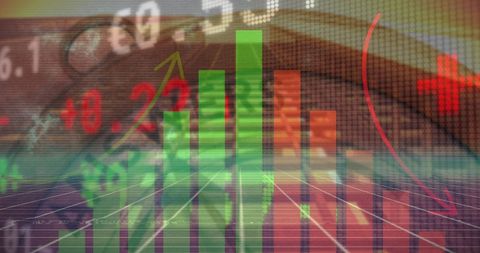
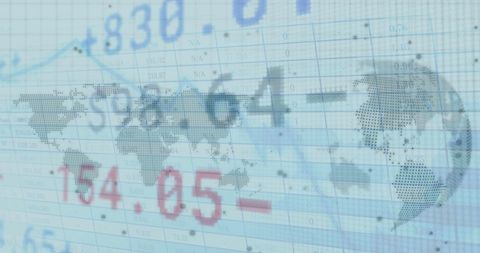
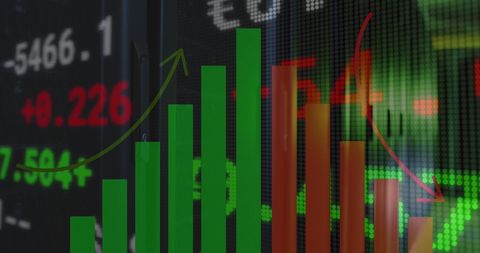
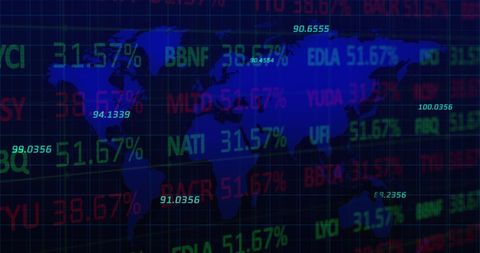
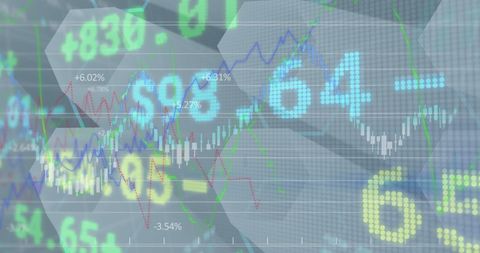
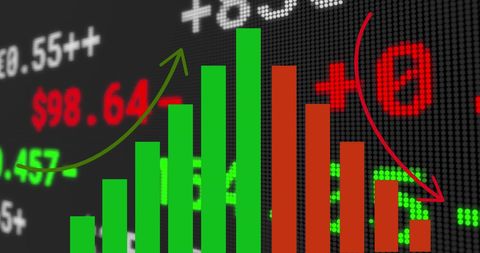
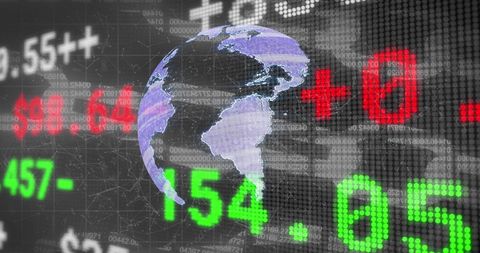
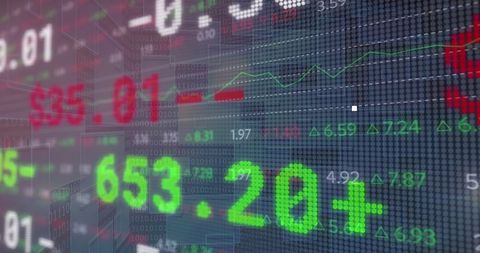
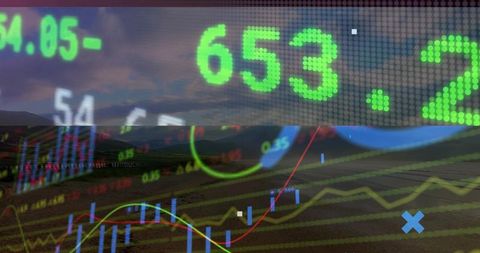
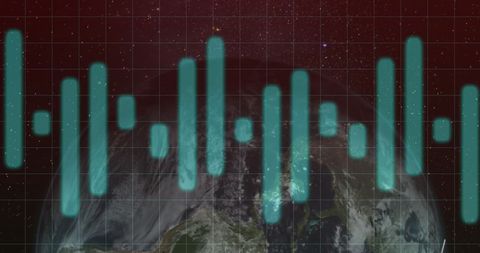
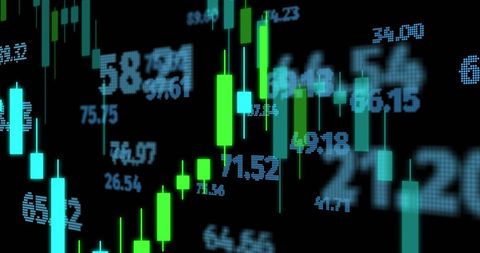
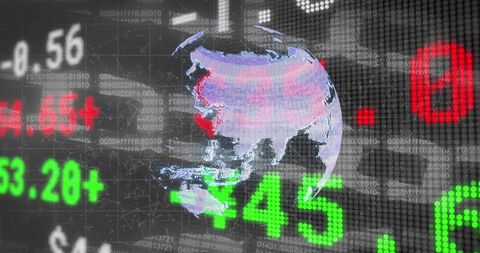
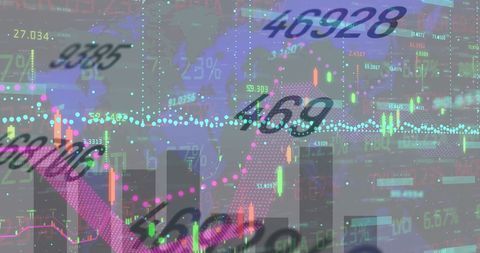
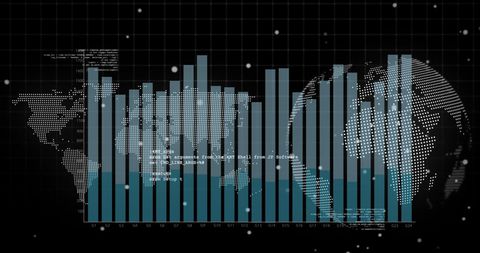
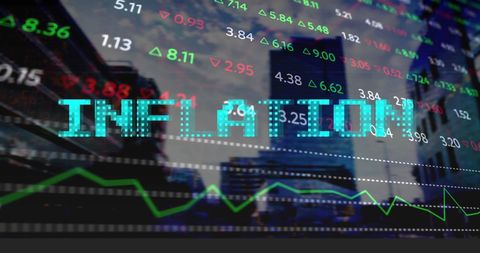
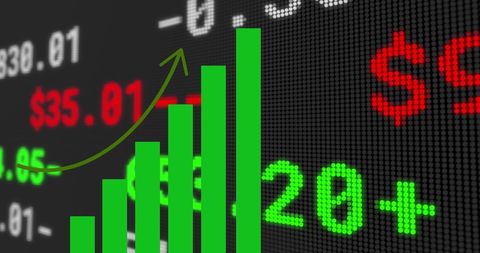
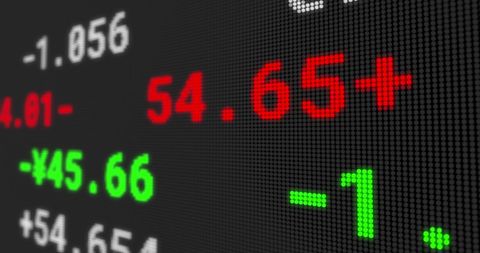
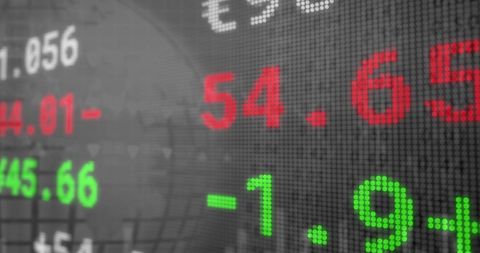
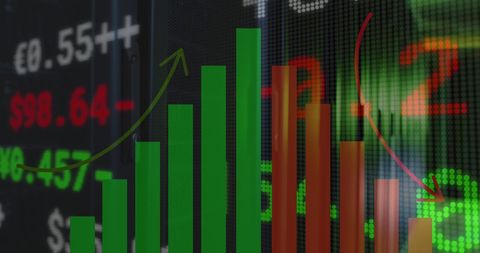
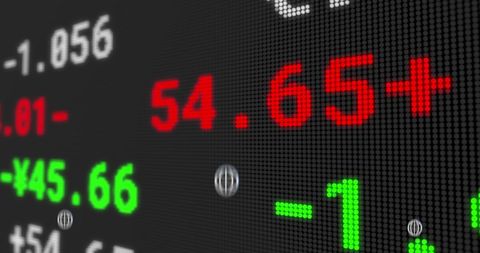
- Global Financial Data Analytics with Interactive Bar Graphs and World Map
Global Financial Data Analytics with Interactive Bar Graphs and World Map Image
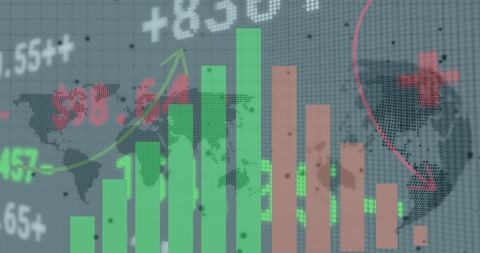
Illustrates financial data processing with vibrant bar graphs overlaying a digital world map. Perfect for content on global finance, economics, digital markets, and statistical analysis. Useful in business presentations, financial reports, and instructional materials to depict global economic growth and data-driven insights.

downloads
Tags:
More
Credit Photo
If you would like to credit the Photo, here are some ways you can do so
Text Link
photo Link
<span class="text-link">
<span>
<a target="_blank" href=https://pikwizard.com/photo/global-financial-data-analytics-with-interactive-bar-graphs-and-world-map/e78600a73e1048b7eb90de2a3a83e460/>PikWizard</a>
</span>
</span>
<span class="image-link">
<span
style="margin: 0 0 20px 0; display: inline-block; vertical-align: middle; width: 100%;"
>
<a
target="_blank"
href="https://pikwizard.com/photo/global-financial-data-analytics-with-interactive-bar-graphs-and-world-map/e78600a73e1048b7eb90de2a3a83e460/"
style="text-decoration: none; font-size: 10px; margin: 0;"
>
<img src="https://pikwizard.com/pw/medium/e78600a73e1048b7eb90de2a3a83e460.jpg" style="margin: 0; width: 100%;" alt="" />
<p style="font-size: 12px; margin: 0;">PikWizard</p>
</a>
</span>
</span>
Free (free of charge)
Free for personal and commercial use.
Author: Creative Art