
- Home >
- Stock Photos >
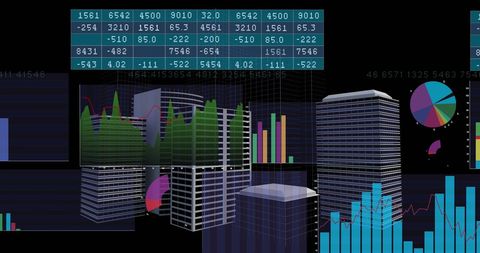
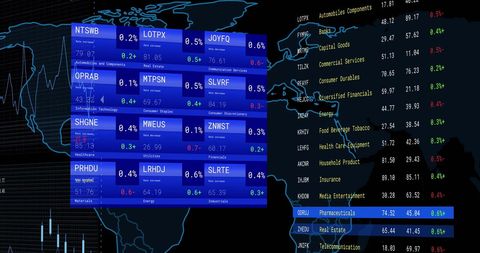
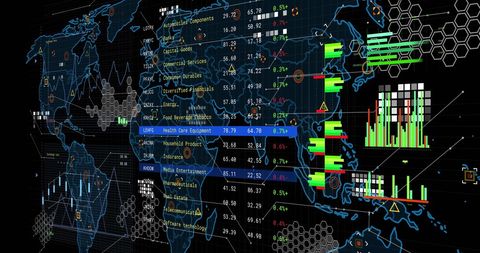
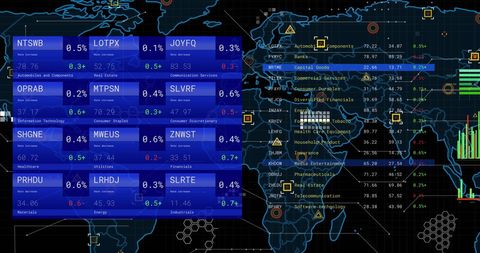
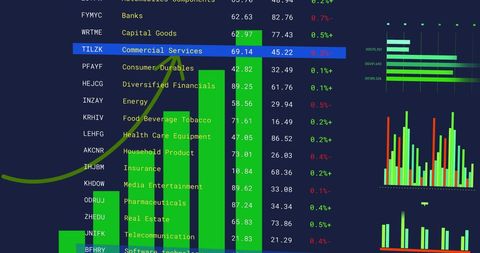
- Global Financial Data Analytics with World Map and Graphs
Global Financial Data Analytics with World Map and Graphs Image
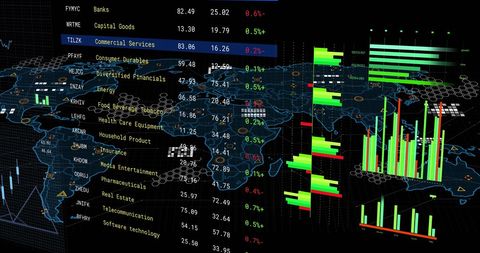
Dynamic visualization of global financial data with various colorful graphs overlaid on world map. Ideal for business presentations on global economic trends, data analysis, and financial technology. Useful for illustrating concepts in business intelligence, financial services marketing, and data-driven decision making.
Powered by  - Get 15% off with code: PIKWIZARD15


downloads
Tags:
More
Credit Photo
If you would like to credit the Photo, here are some ways you can do so
Text Link
photo Link
<span class="text-link">
<span>
<a target="_blank" href=https://pikwizard.com/photo/global-financial-data-analytics-with-world-map-and-graphs/b4d056072b23ee6be17aa7d03ec9f49c/>PikWizard</a>
</span>
</span>
<span class="image-link">
<span
style="margin: 0 0 20px 0; display: inline-block; vertical-align: middle; width: 100%;"
>
<a
target="_blank"
href="https://pikwizard.com/photo/global-financial-data-analytics-with-world-map-and-graphs/b4d056072b23ee6be17aa7d03ec9f49c/"
style="text-decoration: none; font-size: 10px; margin: 0;"
>
<img src="https://pikwizard.com/pw/medium/b4d056072b23ee6be17aa7d03ec9f49c.jpg" style="margin: 0; width: 100%;" alt="" />
<p style="font-size: 12px; margin: 0;">PikWizard</p>
</a>
</span>
</span>
Free (free of charge)
Free for personal and commercial use.
Author: Authentic Images
Similar Free Stock Images

Premium


Premium


Premium


Premium


Premium


Premium


Premium


Premium


Premium


Premium


Premium


Premium


Premium


Premium

AI


Premium


Premium


Premium


Premium

Premium


Premium


Premium


Premium


Premium


Premium


Premium


Explore More Free Stock Images