
- Home >
- Stock Photos >
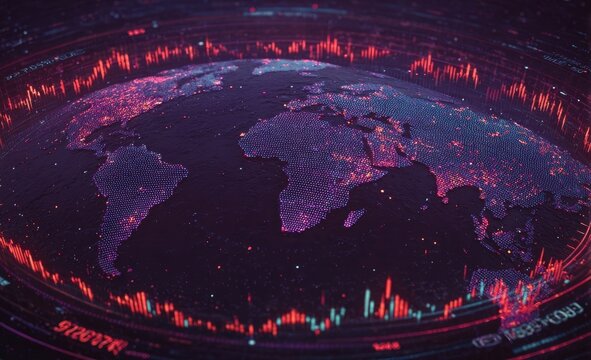
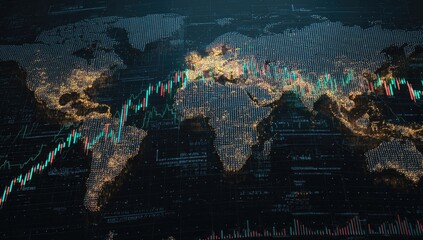
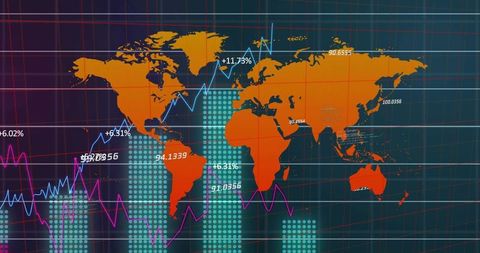
- Global Financial Data Analytics with World Map Background
Global Financial Data Analytics with World Map Background Image
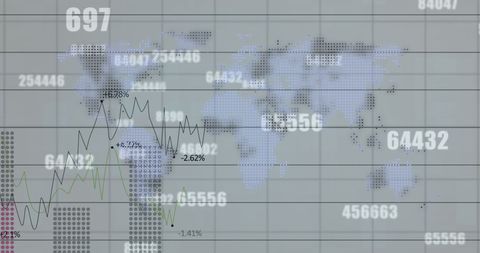
Depicting changing numeric values and data charts over a digital world map, this image conceptualizes global financial analytics. Ideal for illustrating topics in economic data analysis, stock market trends, international business evaluations, and digital financial tools.
Powered by 


downloads
Tags:
More
Credit Photo
If you would like to credit the Photo, here are some ways you can do so
Text Link
photo Link
<span class="text-link">
<span>
<a target="_blank" href=https://pikwizard.com/photo/global-financial-data-analytics-with-world-map-background/48d4f70b5a568af23aefcd7cd9b65934/>PikWizard</a>
</span>
</span>
<span class="image-link">
<span
style="margin: 0 0 20px 0; display: inline-block; vertical-align: middle; width: 100%;"
>
<a
target="_blank"
href="https://pikwizard.com/photo/global-financial-data-analytics-with-world-map-background/48d4f70b5a568af23aefcd7cd9b65934/"
style="text-decoration: none; font-size: 10px; margin: 0;"
>
<img src="https://pikwizard.com/pw/medium/48d4f70b5a568af23aefcd7cd9b65934.jpg" style="margin: 0; width: 100%;" alt="" />
<p style="font-size: 12px; margin: 0;">PikWizard</p>
</a>
</span>
</span>
Free (free of charge)
Free for personal and commercial use.
Author: Authentic Images
Similar Free Stock Images

Premium


Premium


Premium


Premium


Premium


Premium


Premium


Premium

Premium


Premium


Premium


Premium


Premium

Premium

Premium


Premium

Premium


Premium


Premium


Premium


Premium


Premium


Premium


Premium

Premium


Explore More Free Stock Images