
- Home >
- Stock Photos >
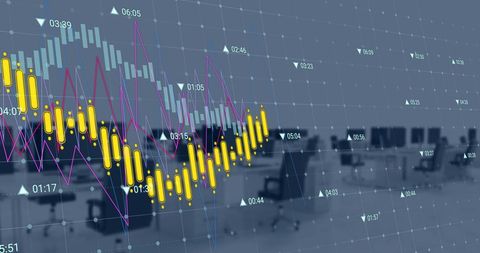
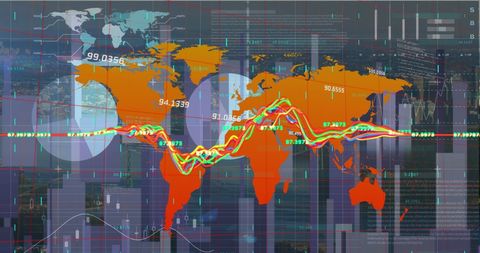
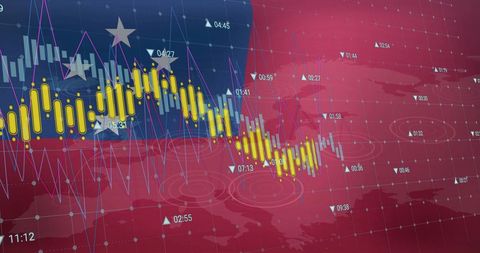
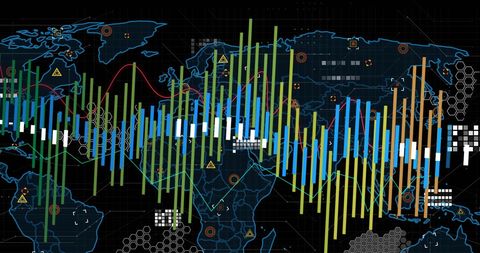
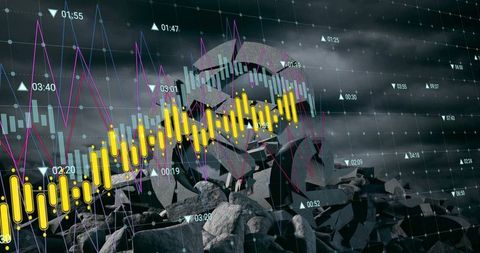
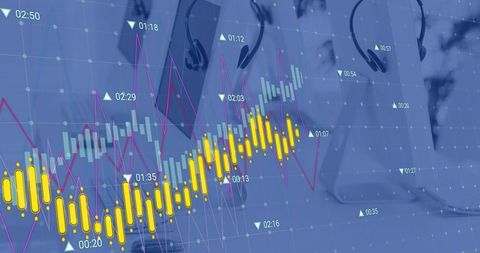
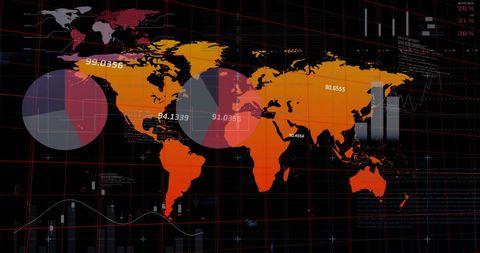
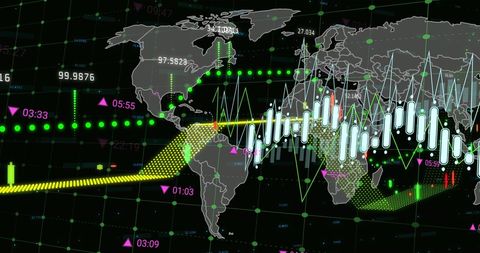
- Global Financial Data Analytics with World Map Visualization
Global Financial Data Analytics with World Map Visualization Image
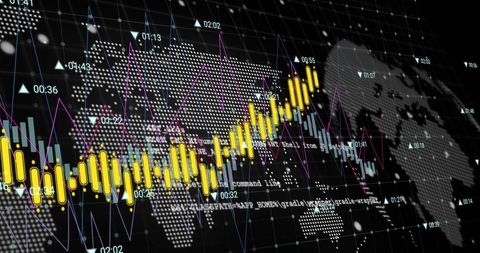
This visualization captures the interplay of global financial data and analytics overlaid on a world map. With charts and data lines, it is ideal for illustrating topics related to global business, digital finance, investment strategies, and economic analysis. Perfect for use in financial reports, business presentations, or educational materials involving finance and data interpretation.
Powered by 


downloads
Tags:
More
Credit Photo
If you would like to credit the Photo, here are some ways you can do so
Text Link
photo Link
<span class="text-link">
<span>
<a target="_blank" href=https://pikwizard.com/photo/global-financial-data-analytics-with-world-map-visualization/75e9d0542457684cb977145b09db993b/>PikWizard</a>
</span>
</span>
<span class="image-link">
<span
style="margin: 0 0 20px 0; display: inline-block; vertical-align: middle; width: 100%;"
>
<a
target="_blank"
href="https://pikwizard.com/photo/global-financial-data-analytics-with-world-map-visualization/75e9d0542457684cb977145b09db993b/"
style="text-decoration: none; font-size: 10px; margin: 0;"
>
<img src="https://pikwizard.com/pw/medium/75e9d0542457684cb977145b09db993b.jpg" style="margin: 0; width: 100%;" alt="" />
<p style="font-size: 12px; margin: 0;">PikWizard</p>
</a>
</span>
</span>
Free (free of charge)
Free for personal and commercial use.
Author: Awesome Content
Similar Free Stock Images
Premium


Premium

Premium

Premium


Premium


Premium

Premium


Premium

Premium


Premium


Premium


Premium


Premium


Premium


Premium


Premium


Premium


Premium

Premium


Premium


Premium


Premium


Premium


Premium


Premium


Explore More Free Stock Images