- Home >
- Stock Photos >
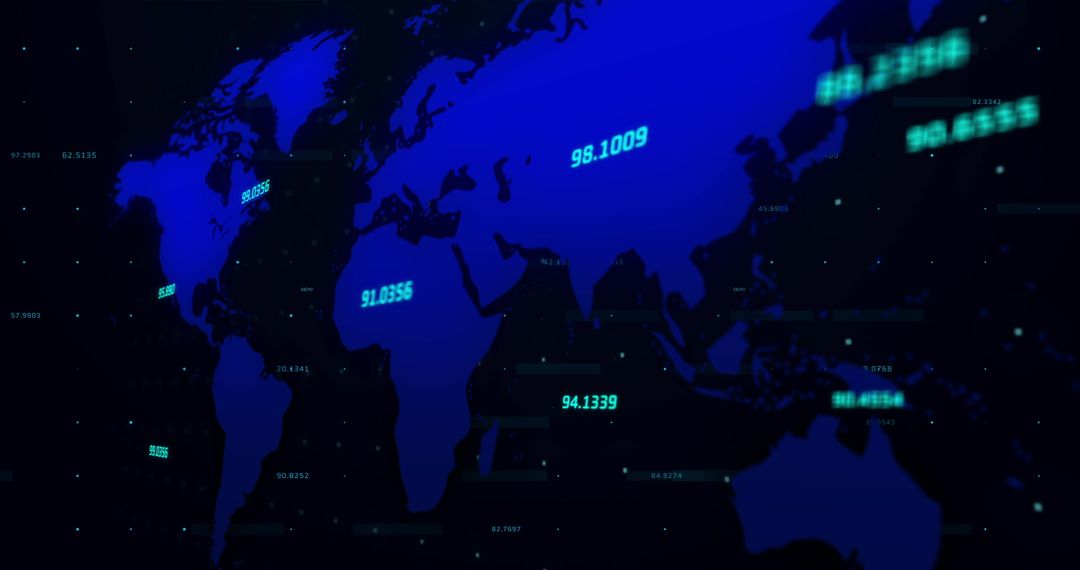
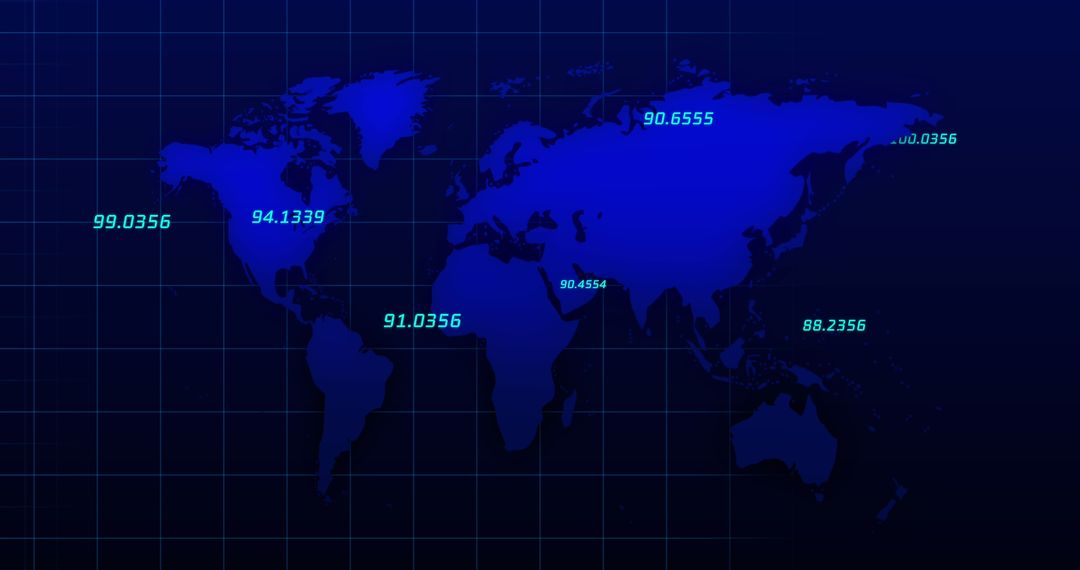
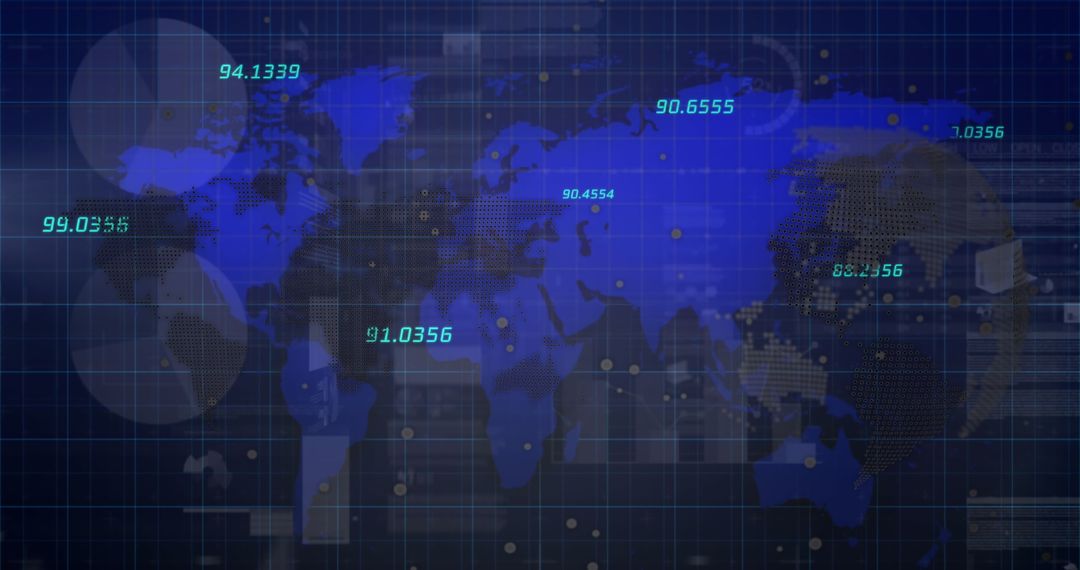
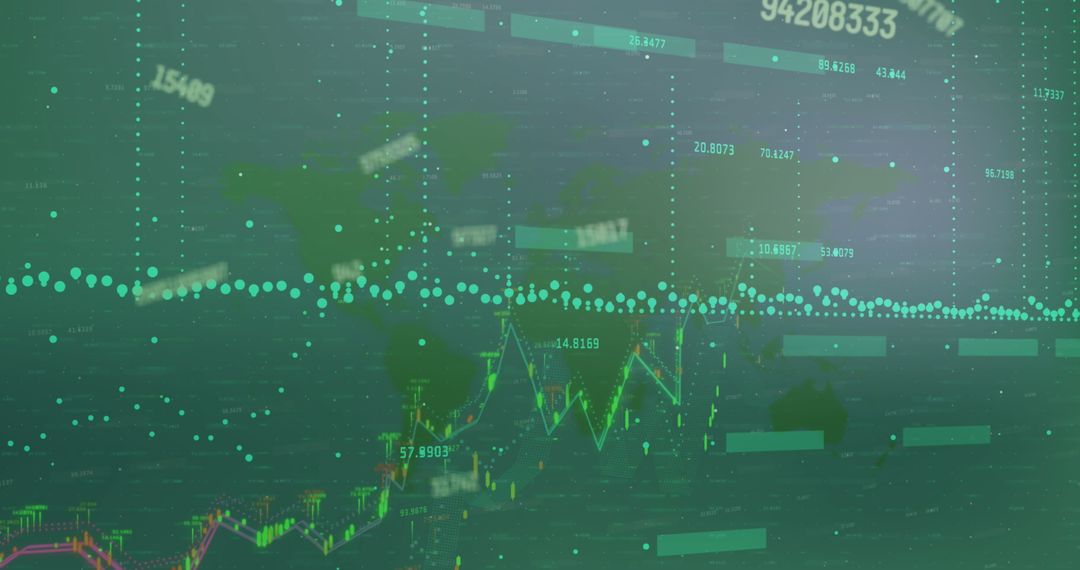
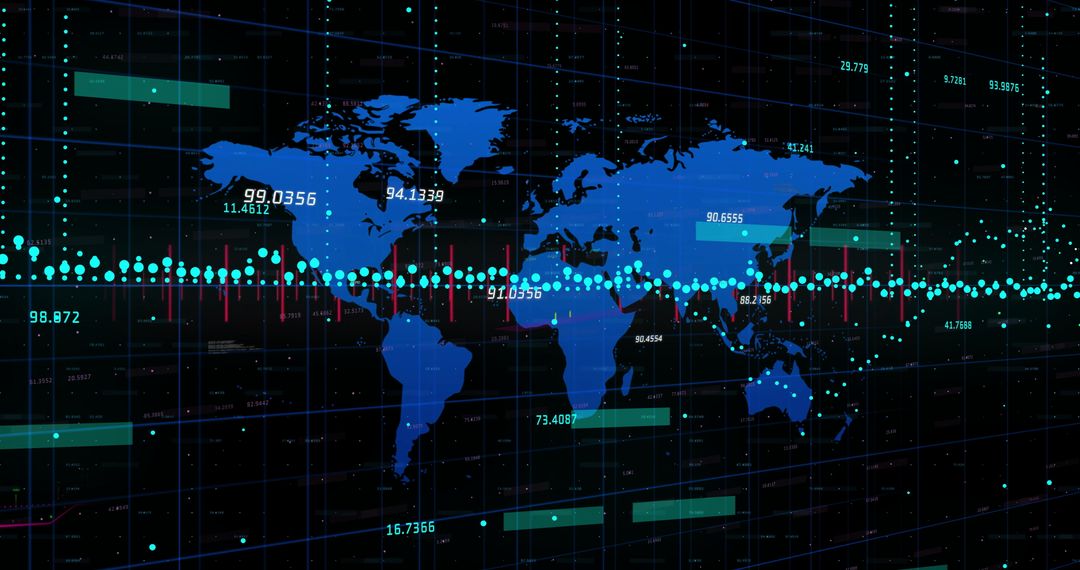
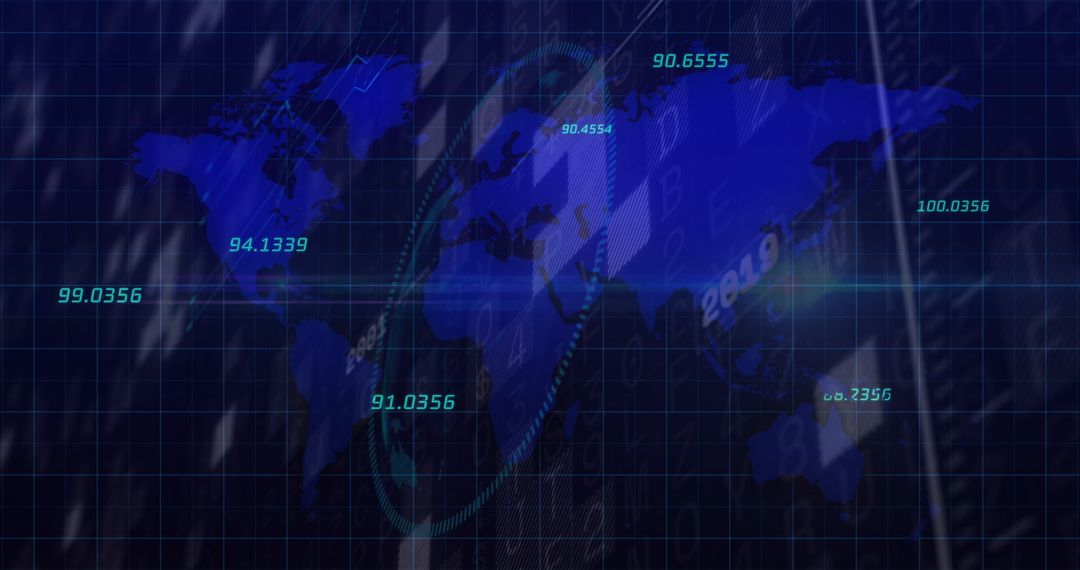
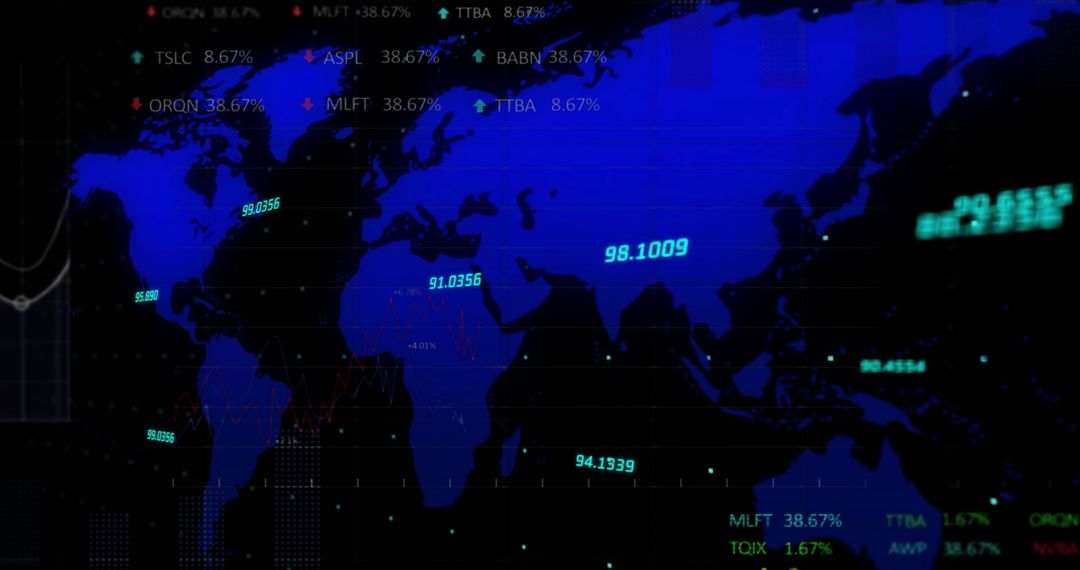
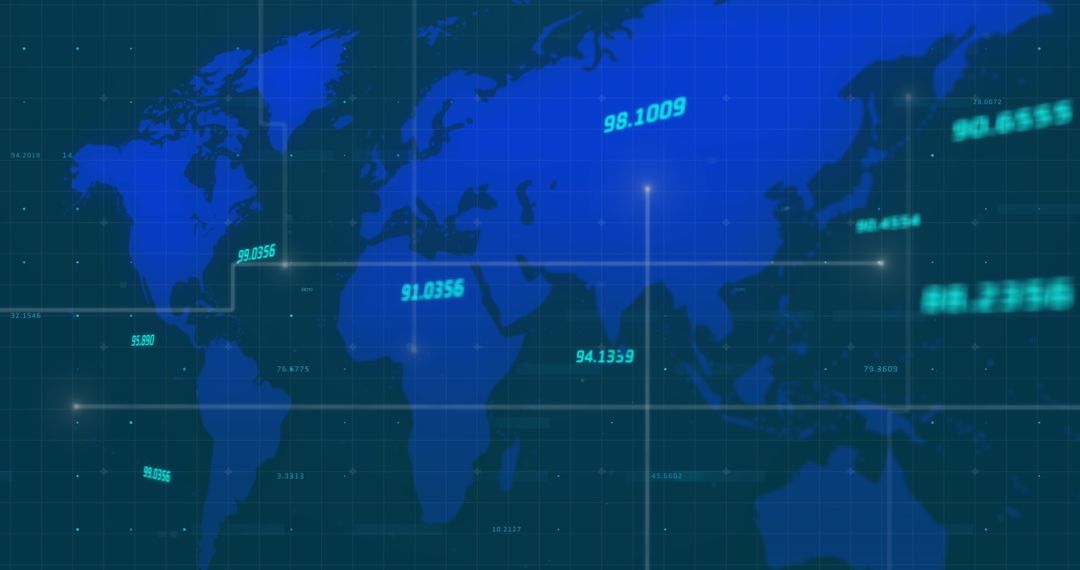
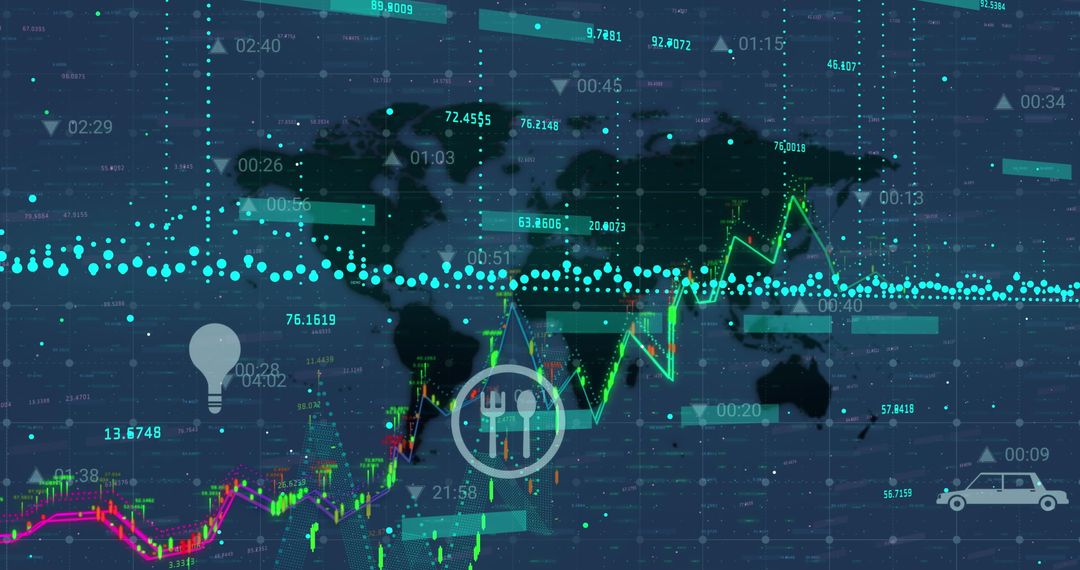
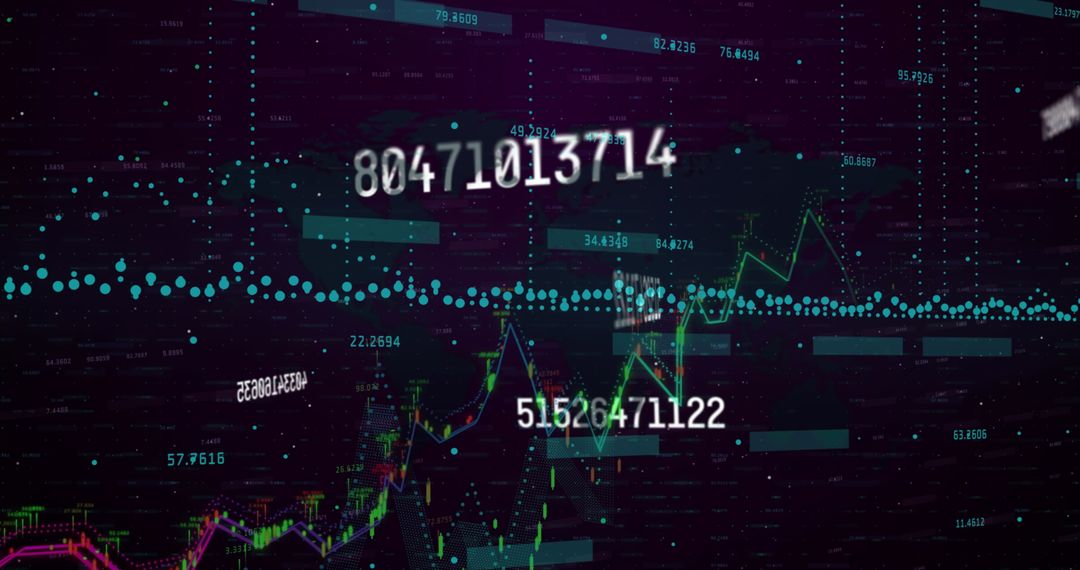
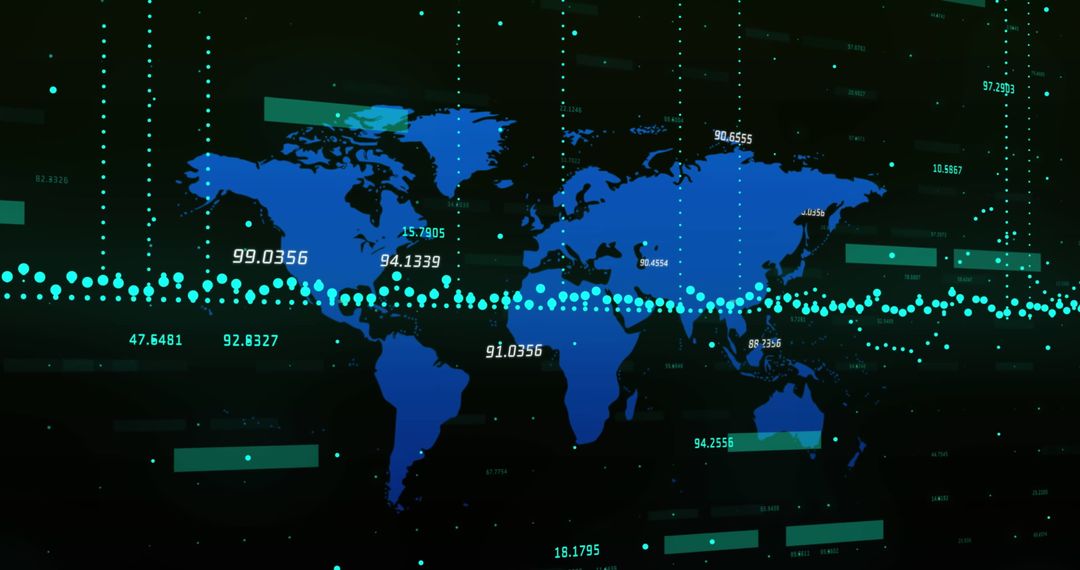
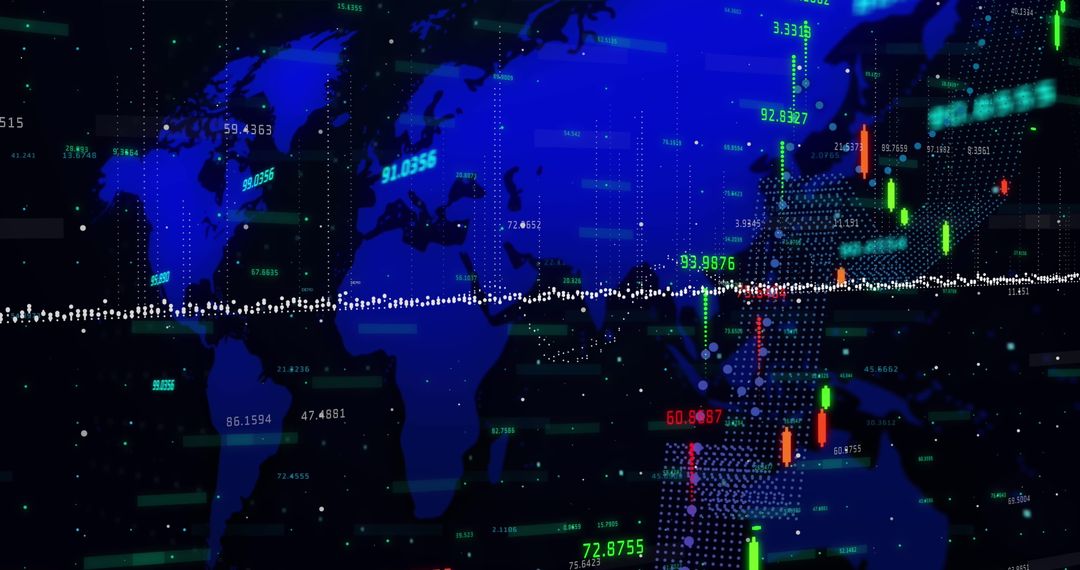
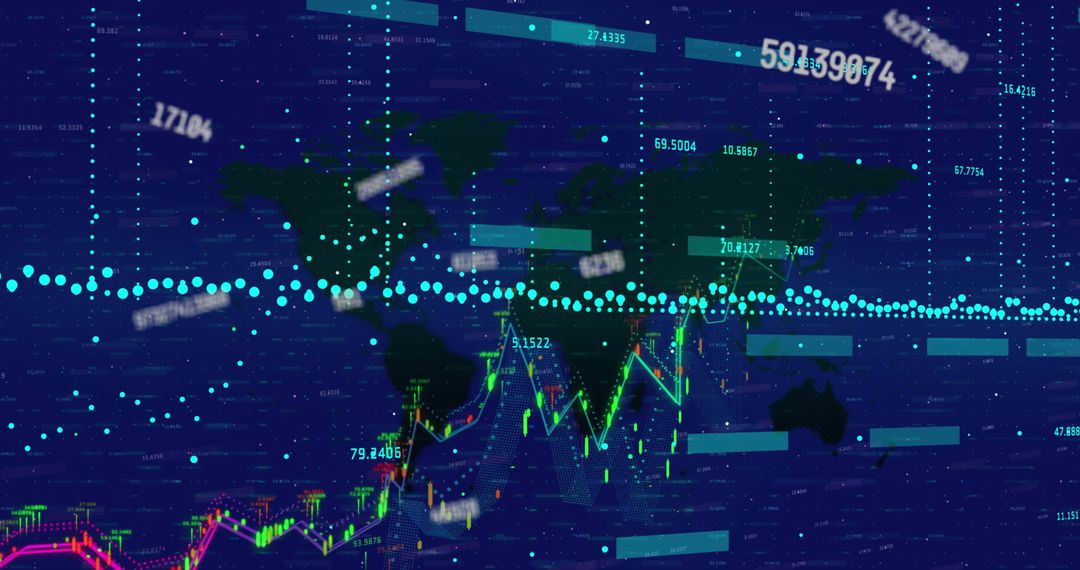
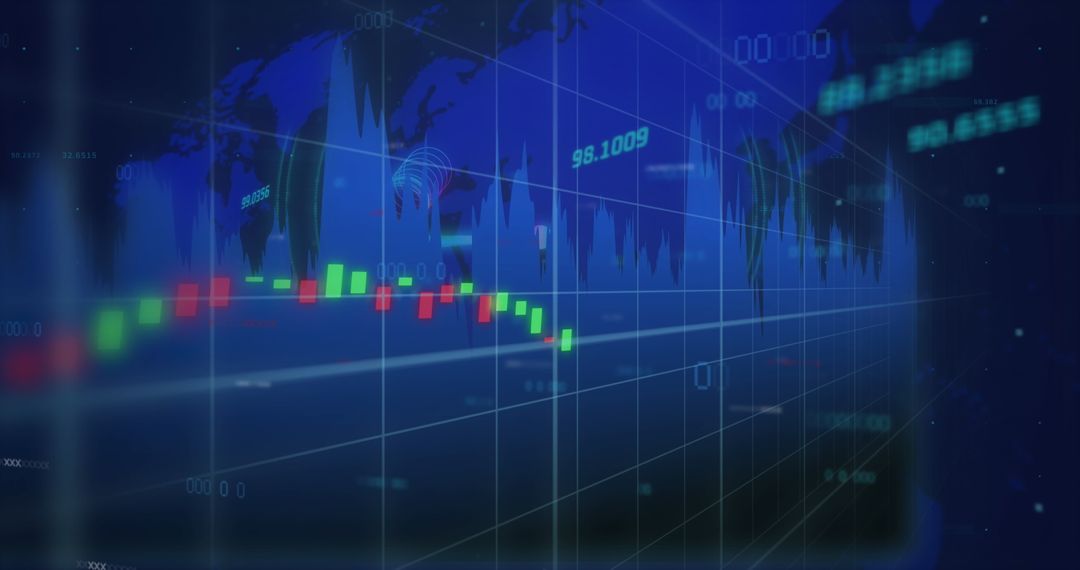
- Global Financial Data Analyzing Hologram with World Map
Global Financial Data Analyzing Hologram with World Map Image

Graphic depicting a digital presentation of global financial data with various graphs and numerical figures overlaying a world map on a deep blue background. Represents analysis, tech innovations, finance, or data-driven studies. Ideal for tech-themed content, financial reports, global market pieces, or digital design illustrations.
Powered by  - Get 15% off with code: PIKWIZARD15


2
downloads
downloads
Tags:
More
Credit Photo
If you would like to credit the Photo, here are some ways you can do so
Text Link
photo Link
<span class="text-link">
<span>
<a target="_blank" href=https://pikwizard.com/photo/global-financial-data-analyzing-hologram-with-world-map/09945b554499ac2d3ffe07fa21c25fcb/>PikWizard</a>
</span>
</span>
<span class="image-link">
<span
style="margin: 0 0 20px 0; display: inline-block; vertical-align: middle; width: 100%;"
>
<a
target="_blank"
href="https://pikwizard.com/photo/global-financial-data-analyzing-hologram-with-world-map/09945b554499ac2d3ffe07fa21c25fcb/"
style="text-decoration: none; font-size: 10px; margin: 0;"
>
<img src="https://pikwizard.com/pw/medium/09945b554499ac2d3ffe07fa21c25fcb.jpg" style="margin: 0; width: 100%;" alt="" />
<p style="font-size: 12px; margin: 0;">PikWizard</p>
</a>
</span>
</span>
Free (free of charge)
Free for personal and commercial use.
Author: Authentic Images
Similar Free Stock Images
Premium


Premium


Premium


Premium


Premium


Premium


Premium


Premium


Premium


Premium


Premium


Premium


Premium


Premium


Premium


Premium


Premium


Premium


Premium


Premium


Premium


Premium


Premium


Premium