- Home >
- Stock Photos >
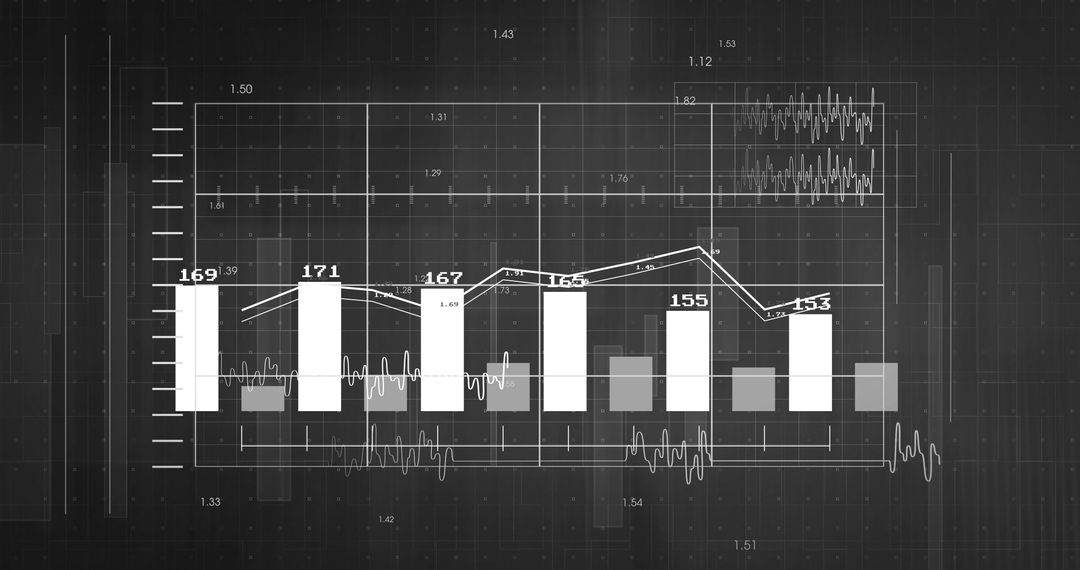
- Global Financial Data and Analytics Concept with Rising Arrow
Global Financial Data and Analytics Concept with Rising Arrow Image

Capturing a digitally-generated interface depicting global financial analytics with a rising arrow symbolizing business growth. Various charts, numbers, and digital diagrams add a futuristic layer, indicating stock market trends and economic data. Ideal for businesses needing a visual representation of economic progress and global market strategies, or for illustrating topics related to analytics, data processing, and financial forecasting.
Powered by 


2
downloads
downloads
Tags:
More
Credit Photo
If you would like to credit the Photo, here are some ways you can do so
Text Link
photo Link
<span class="text-link">
<span>
<a target="_blank" href=https://pikwizard.com/photo/global-financial-data-and-analytics-concept-with-rising-arrow/10a6a26c3796f7a76afa7df81b83bd51/>PikWizard</a>
</span>
</span>
<span class="image-link">
<span
style="margin: 0 0 20px 0; display: inline-block; vertical-align: middle; width: 100%;"
>
<a
target="_blank"
href="https://pikwizard.com/photo/global-financial-data-and-analytics-concept-with-rising-arrow/10a6a26c3796f7a76afa7df81b83bd51/"
style="text-decoration: none; font-size: 10px; margin: 0;"
>
<img src="https://pikwizard.com/pw/medium/10a6a26c3796f7a76afa7df81b83bd51.jpg" style="margin: 0; width: 100%;" alt="" />
<p style="font-size: 12px; margin: 0;">PikWizard</p>
</a>
</span>
</span>
Free (free of charge)
Free for personal and commercial use.
Author: People Creations
Similar Free Stock Images

Premium


Premium


Premium


Premium


Premium


Premium


Premium


Premium


Premium


Premium


Premium


Premium


Premium


Premium


Premium


Premium


Premium


Premium


Premium


Premium


Premium


Premium


Premium


Premium