- Home >
- Stock Photos >
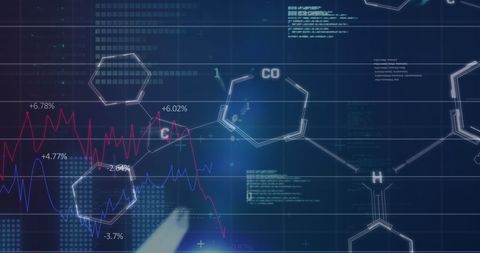
- Global Financial Data and Chemical Structure Integration
Global Financial Data and Chemical Structure Integration Image

Depicting a convergence of global finance and chemistry, abstract financial graphs overlap with chemical structures. This creative depiction highlights interconnected systems suitable for use in promoting technology in finance, advertisements for financial technology services, educational materials or presentations about innovative scientific and financial intersections.

downloads
Tags:
More
Credit Photo
If you would like to credit the Photo, here are some ways you can do so
Text Link
photo Link
<span class="text-link">
<span>
<a target="_blank" href=https://pikwizard.com/photo/global-financial-data-and-chemical-structure-integration/56541b559901b2ff7f4d7d3125c8a3fd/>PikWizard</a>
</span>
</span>
<span class="image-link">
<span
style="margin: 0 0 20px 0; display: inline-block; vertical-align: middle; width: 100%;"
>
<a
target="_blank"
href="https://pikwizard.com/photo/global-financial-data-and-chemical-structure-integration/56541b559901b2ff7f4d7d3125c8a3fd/"
style="text-decoration: none; font-size: 10px; margin: 0;"
>
<img src="https://pikwizard.com/pw/medium/56541b559901b2ff7f4d7d3125c8a3fd.jpg" style="margin: 0; width: 100%;" alt="" />
<p style="font-size: 12px; margin: 0;">PikWizard</p>
</a>
</span>
</span>
Free (free of charge)
Free for personal and commercial use.
Author: Awesome Content