
- Home >
- Stock Photos >
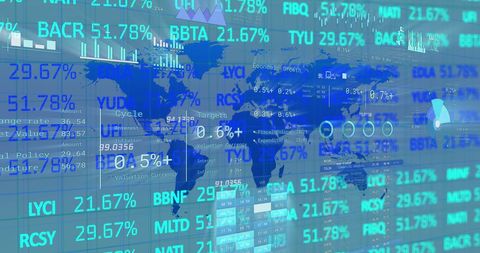
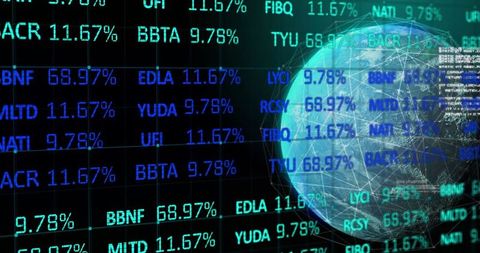
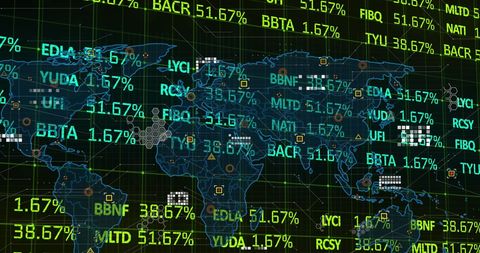
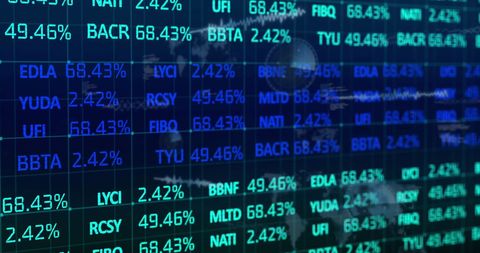
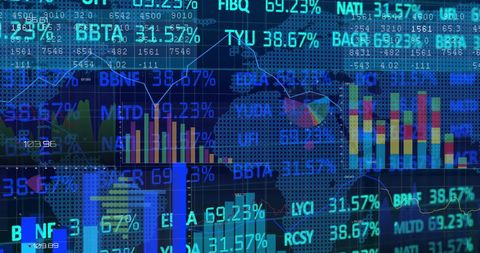
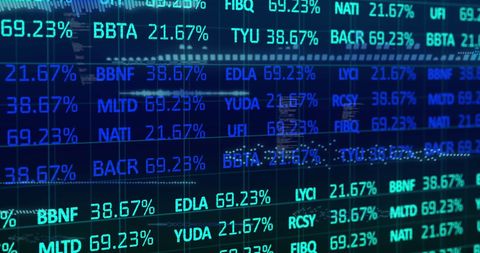
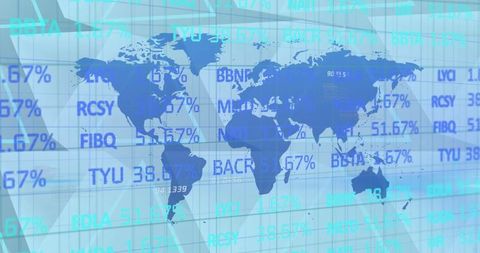
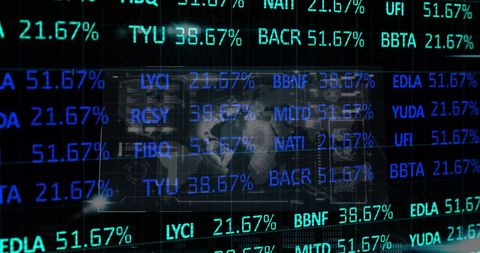
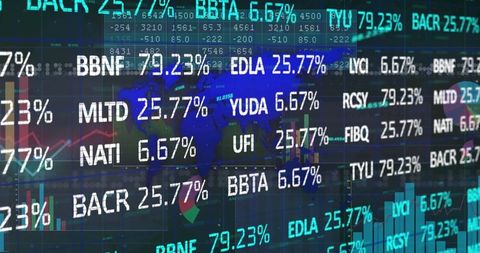
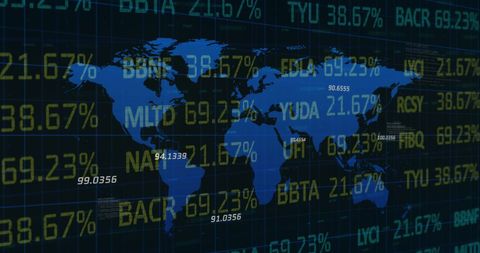
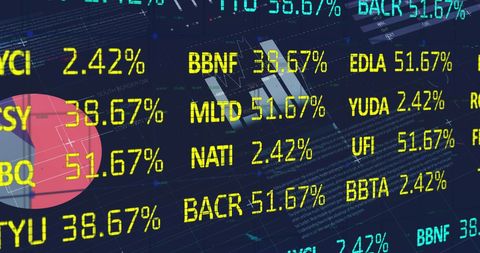
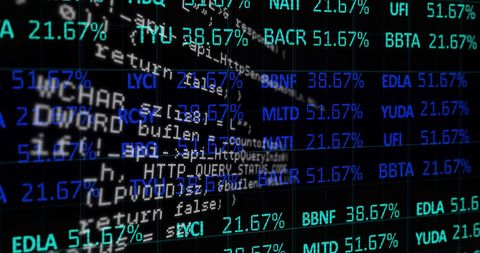
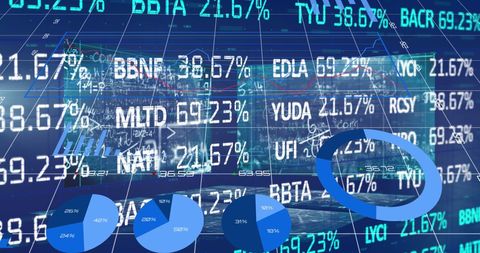
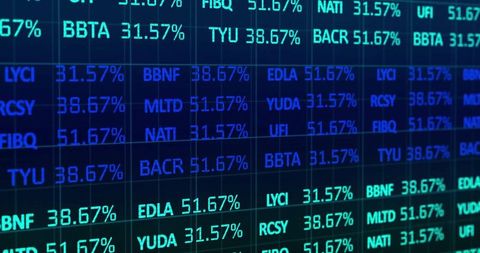
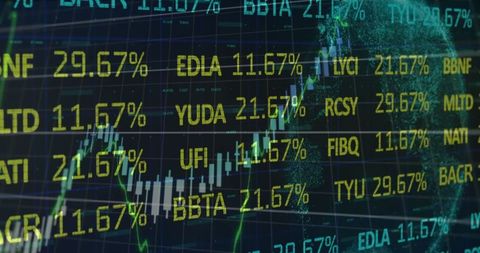
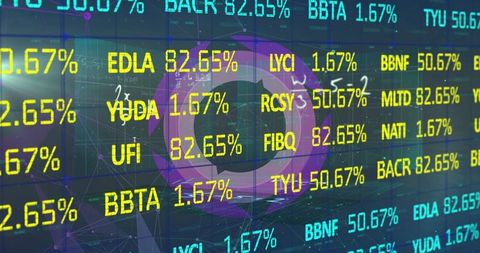
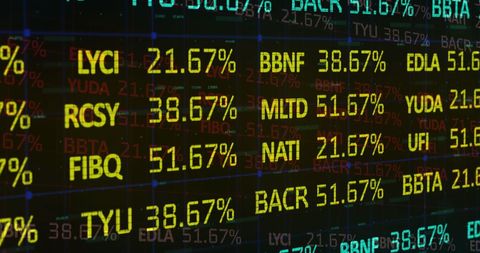
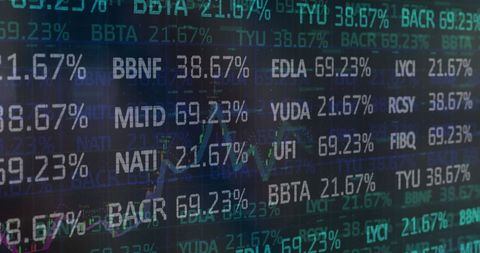
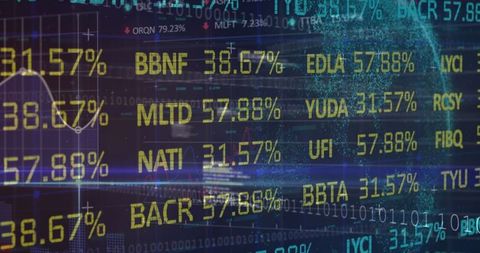
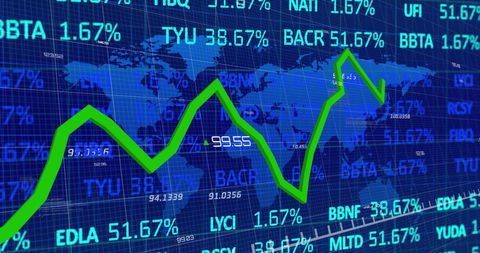
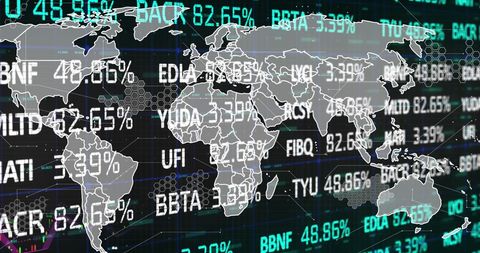
- Global Financial Data and Digital Analytics Visualization
Global Financial Data and Digital Analytics Visualization Image
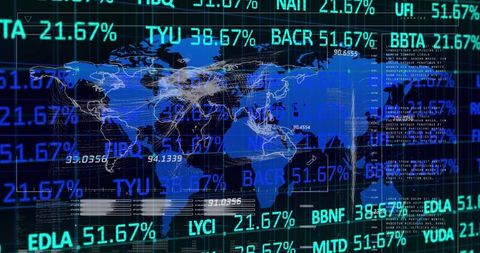
Digital screen displays global financial data overlaid on world map, showcasing percentages and analytics for stock market tracking and economic globalization. Ideal for use in presentations and discussions related to financial technology, stock trading enhancements, global economic reports, and digital data processing innovations.
Powered by 


downloads
Tags:
More
Credit Photo
If you would like to credit the Photo, here are some ways you can do so
Text Link
photo Link
<span class="text-link">
<span>
<a target="_blank" href=https://pikwizard.com/photo/global-financial-data-and-digital-analytics-visualization/badda9cc0c857bd395d02517040138eb/>PikWizard</a>
</span>
</span>
<span class="image-link">
<span
style="margin: 0 0 20px 0; display: inline-block; vertical-align: middle; width: 100%;"
>
<a
target="_blank"
href="https://pikwizard.com/photo/global-financial-data-and-digital-analytics-visualization/badda9cc0c857bd395d02517040138eb/"
style="text-decoration: none; font-size: 10px; margin: 0;"
>
<img src="https://pikwizard.com/pw/medium/badda9cc0c857bd395d02517040138eb.jpg" style="margin: 0; width: 100%;" alt="" />
<p style="font-size: 12px; margin: 0;">PikWizard</p>
</a>
</span>
</span>
Free (free of charge)
Free for personal and commercial use.
Author: Authentic Images
Similar Free Stock Images
Premium


Premium


Premium


Premium


Premium


Premium

Premium

Premium


Premium


Premium

Premium

Premium


Premium


Premium


Premium


Premium


Premium

Premium


Premium


Premium


Premium

Premium

Premium

Premium


Premium


Explore More Free Stock Images