
- Home >
- Stock Photos >
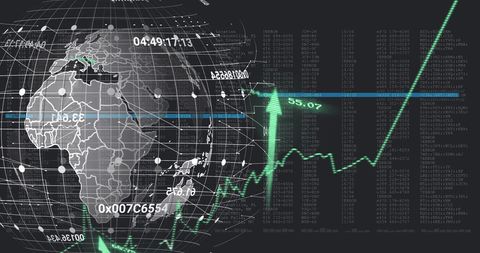
- Global Financial Data and Digital Connectivity Concept
Global Financial Data and Digital Connectivity Concept Image

Depicts interconnectedness of global finance through digital overlays. Ideal for illustrating concepts in global economics, corporate financial analysis, technology's impact on markets, and international business strategy. Useful for educational materials, business presentations, and financial reports.
Powered by  - Get 15% off with code: PIKWIZARD15


downloads
Tags:
More
Credit Photo
If you would like to credit the Photo, here are some ways you can do so
Text Link
photo Link
<span class="text-link">
<span>
<a target="_blank" href=https://pikwizard.com/photo/global-financial-data-and-digital-connectivity-concept/f2b217ff8293483dd032ab60ffd2a778/>PikWizard</a>
</span>
</span>
<span class="image-link">
<span
style="margin: 0 0 20px 0; display: inline-block; vertical-align: middle; width: 100%;"
>
<a
target="_blank"
href="https://pikwizard.com/photo/global-financial-data-and-digital-connectivity-concept/f2b217ff8293483dd032ab60ffd2a778/"
style="text-decoration: none; font-size: 10px; margin: 0;"
>
<img src="https://pikwizard.com/pw/medium/f2b217ff8293483dd032ab60ffd2a778.jpg" style="margin: 0; width: 100%;" alt="" />
<p style="font-size: 12px; margin: 0;">PikWizard</p>
</a>
</span>
</span>
Free (free of charge)
Free for personal and commercial use.
Author: People Creations
Similar Free Stock Images

Premium


Premium

Premium


Premium


Premium


Premium


Premium


Premium

Premium

Premium

Premium


Premium


Premium


Premium


Premium


Premium


Premium


Premium


Premium


Premium


Premium

Premium


Premium


Premium


Premium


Explore More Free Stock Images