
- Home >
- Stock Photos >
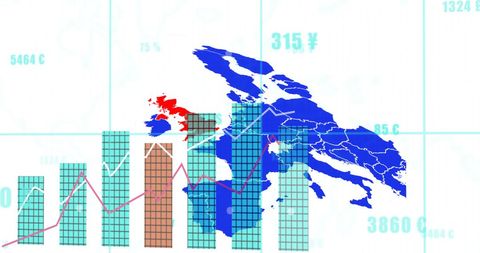
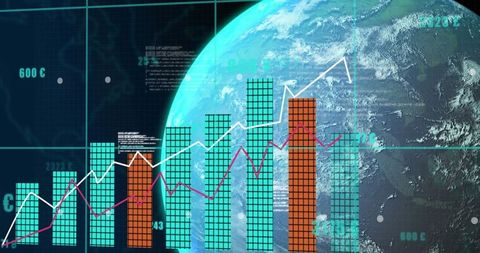
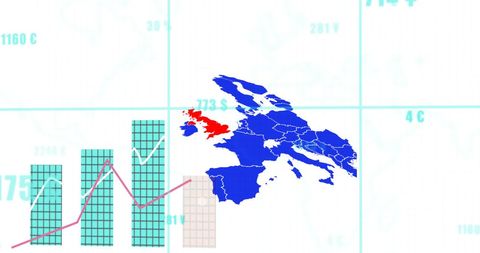
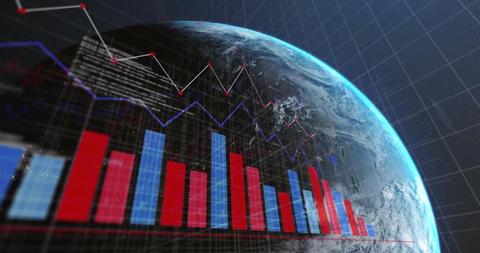
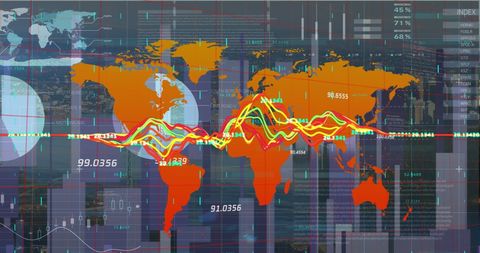
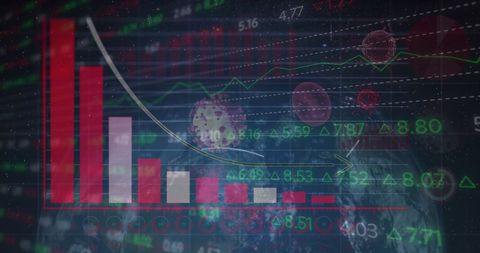
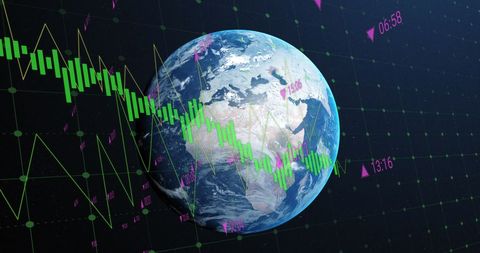
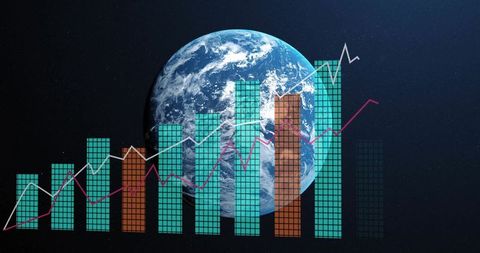
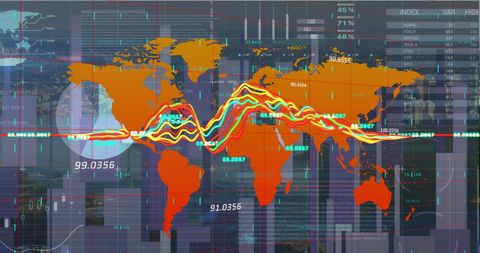
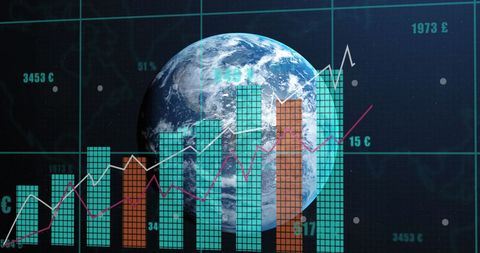
- Global Financial Data and Digital Trading Interface
Global Financial Data and Digital Trading Interface Image
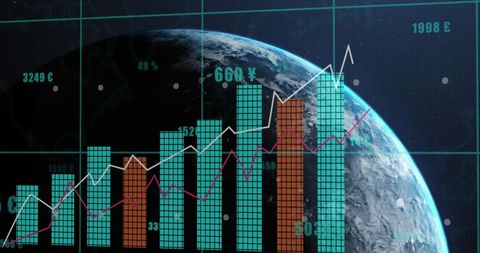
This depiction of global financial data over a globe with digital charts and graphs suggests international stock trading and data processing. Useful for illustrating complex financial systems, global economics, or digital financial technology in presentations, articles, and educational materials.
Powered by 


downloads
Tags:
More
Credit Photo
If you would like to credit the Photo, here are some ways you can do so
Text Link
photo Link
<span class="text-link">
<span>
<a target="_blank" href=https://pikwizard.com/photo/global-financial-data-and-digital-trading-interface/90fdf4abf6b666fece1aed508327d4b7/>PikWizard</a>
</span>
</span>
<span class="image-link">
<span
style="margin: 0 0 20px 0; display: inline-block; vertical-align: middle; width: 100%;"
>
<a
target="_blank"
href="https://pikwizard.com/photo/global-financial-data-and-digital-trading-interface/90fdf4abf6b666fece1aed508327d4b7/"
style="text-decoration: none; font-size: 10px; margin: 0;"
>
<img src="https://pikwizard.com/pw/medium/90fdf4abf6b666fece1aed508327d4b7.jpg" style="margin: 0; width: 100%;" alt="" />
<p style="font-size: 12px; margin: 0;">PikWizard</p>
</a>
</span>
</span>
Free (free of charge)
Free for personal and commercial use.
Author: Creative Art
Similar Free Stock Images

Premium


Premium

Premium


Premium


Premium

Premium


Premium


Premium


Premium


Premium

Premium

Premium


Premium


Premium

Premium

Premium


Premium

Premium


Premium


Premium
Premium


Premium


Premium

Premium

Premium


Explore More Free Stock Images