- Home >
- Stock Photos >
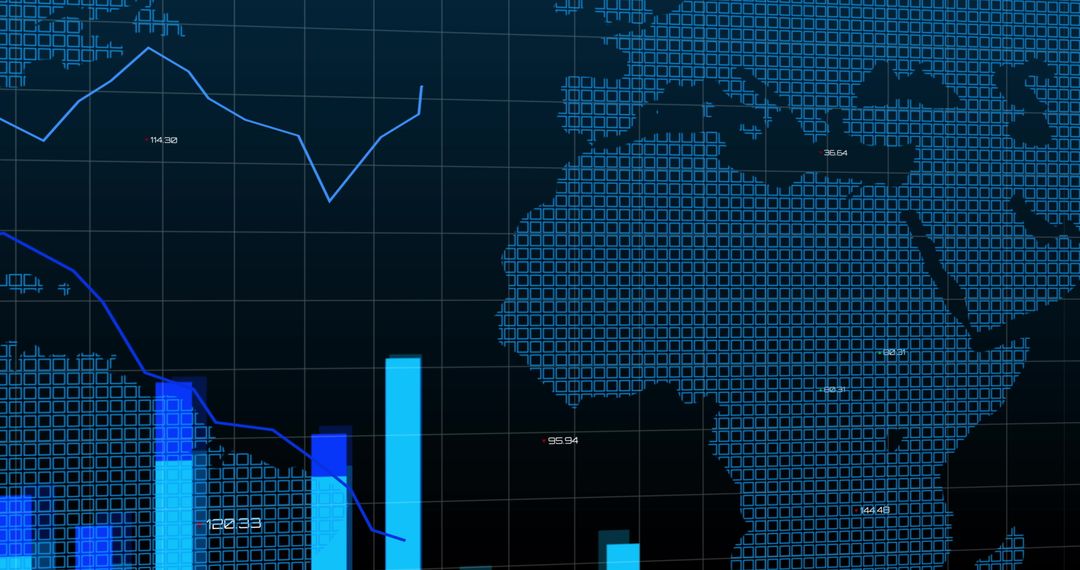
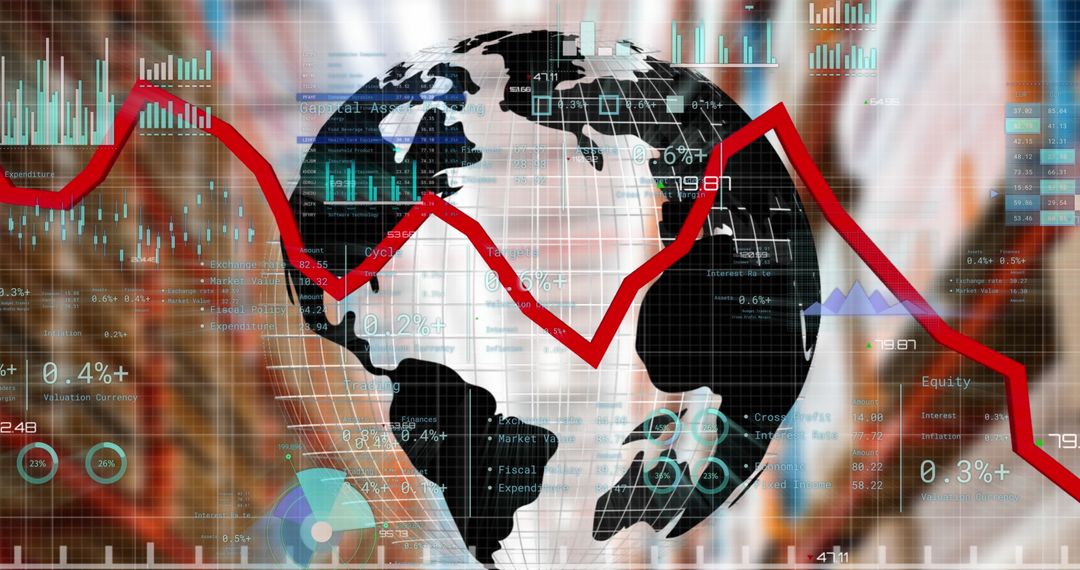
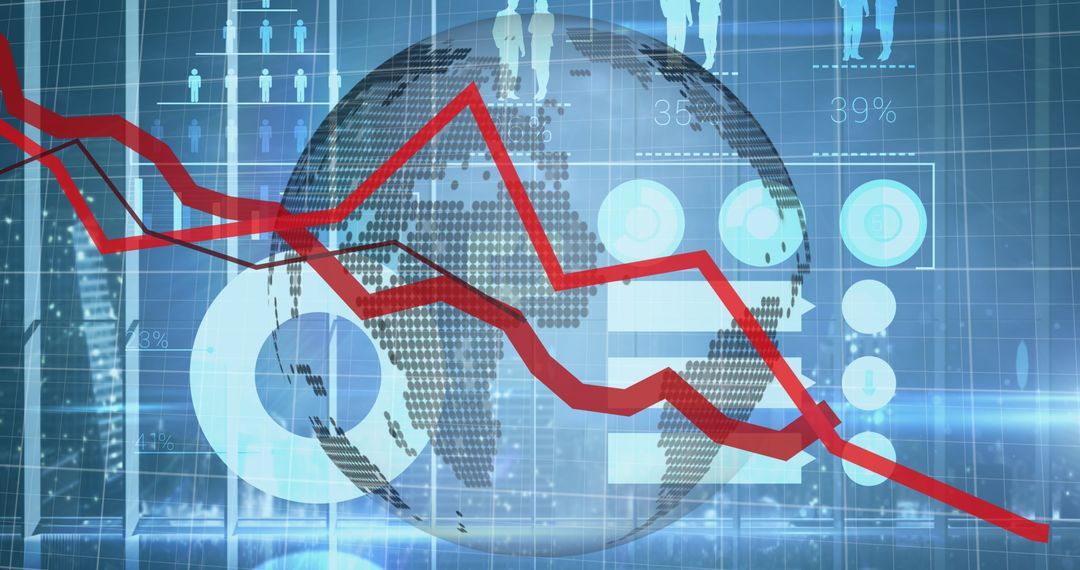
- Global Financial Data and Dynamic Market Analytics
Global Financial Data and Dynamic Market Analytics Image

Perfect for illustrating topics in financial analytics, global market trends, or economic reports. Useful for business presentations, technology blogs, and investment insights. The combination of world map and data visualization elements shows the interconnectedness of global economies.
Powered by 


0
downloads
downloads
Tags:
More
Credit Photo
If you would like to credit the Photo, here are some ways you can do so
Text Link
photo Link
<span class="text-link">
<span>
<a target="_blank" href=https://pikwizard.com/photo/global-financial-data-and-dynamic-market-analytics/158d536e0c7a0e0fc9de8e3cb9ae3f8d/>PikWizard</a>
</span>
</span>
<span class="image-link">
<span
style="margin: 0 0 20px 0; display: inline-block; vertical-align: middle; width: 100%;"
>
<a
target="_blank"
href="https://pikwizard.com/photo/global-financial-data-and-dynamic-market-analytics/158d536e0c7a0e0fc9de8e3cb9ae3f8d/"
style="text-decoration: none; font-size: 10px; margin: 0;"
>
<img src="https://pikwizard.com/pw/medium/158d536e0c7a0e0fc9de8e3cb9ae3f8d.jpg" style="margin: 0; width: 100%;" alt="" />
<p style="font-size: 12px; margin: 0;">PikWizard</p>
</a>
</span>
</span>
Free (free of charge)
Free for personal and commercial use.
Author: Authentic Images
Similar Free Stock Images
Premium


Premium


Premium


Premium


Premium


Premium


Premium


Premium


Premium


Premium


Premium


Premium


Premium


Premium


Premium


Premium


Premium


Premium


Premium


Premium


Premium


Premium


Premium


Premium