
- Home >
- Stock Photos >
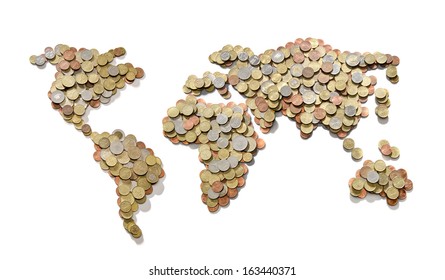
- Global Financial Data and Statistics with Blue World Map Overlay
Global Financial Data and Statistics with Blue World Map Overlay Image

This digitally created representation of global financial data features a prominent blue world map overlaid with statistics and graphs, ideal for use in business presentations, economic reports, or financial market analysis articles highlighting international market trends and economic growth insights.
Powered by  - Get 15% off with code: PIKWIZARD15


2
downloads
downloads
Tags:
More
Credit Photo
If you would like to credit the Photo, here are some ways you can do so
Text Link
photo Link
<span class="text-link">
<span>
<a target="_blank" href=https://pikwizard.com/photo/global-financial-data-and-statistics-with-blue-world-map-overlay/b1f7d269a7ad5ada7cf0f997c838dc3f/>PikWizard</a>
</span>
</span>
<span class="image-link">
<span
style="margin: 0 0 20px 0; display: inline-block; vertical-align: middle; width: 100%;"
>
<a
target="_blank"
href="https://pikwizard.com/photo/global-financial-data-and-statistics-with-blue-world-map-overlay/b1f7d269a7ad5ada7cf0f997c838dc3f/"
style="text-decoration: none; font-size: 10px; margin: 0;"
>
<img src="https://pikwizard.com/pw/medium/b1f7d269a7ad5ada7cf0f997c838dc3f.jpg" style="margin: 0; width: 100%;" alt="" />
<p style="font-size: 12px; margin: 0;">PikWizard</p>
</a>
</span>
</span>
Free (free of charge)
Free for personal and commercial use.
Author: People Creations
Similar Free Stock Images

Premium


Premium


Premium


Premium


Premium


Premium


Premium


Premium


Premium


Premium


Premium


Premium


Premium


Premium


Premium


Premium


Premium


Premium


Premium


Premium


Premium


Premium


Premium


Premium

