
- Home >
- Stock Photos >
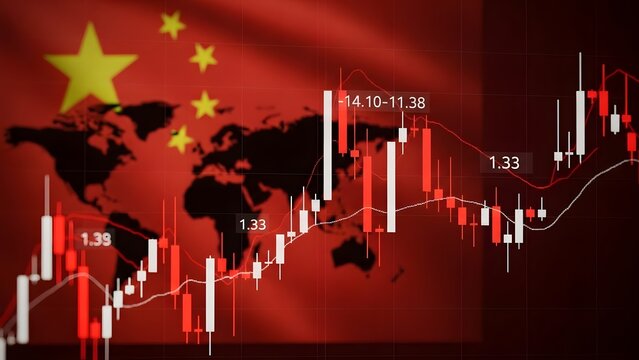
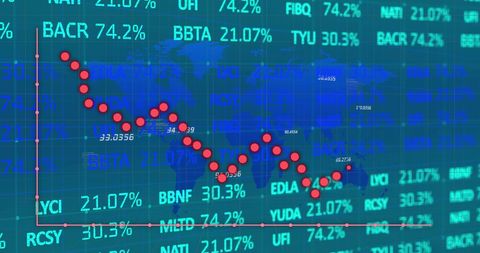
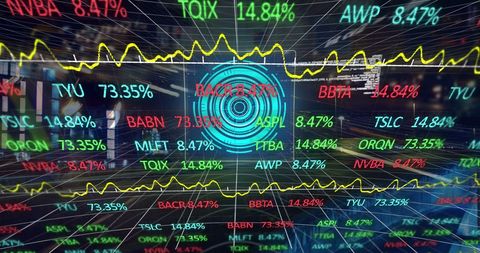
- Global Financial Data and Stock Market Analytics
Global Financial Data and Stock Market Analytics Image

Combining financial data representation and stock market analytics over a world map, this visualization highlights global market trends and financial dynamics. Useful for finance presentations, market analysis discussions, or technological advancements in banking brochures.
Powered by 


downloads
Tags:
More
Credit Photo
If you would like to credit the Photo, here are some ways you can do so
Text Link
photo Link
<span class="text-link">
<span>
<a target="_blank" href=https://pikwizard.com/photo/global-financial-data-and-stock-market-analytics/4ba0255d1aa1289b48a73d7b13544de5/>PikWizard</a>
</span>
</span>
<span class="image-link">
<span
style="margin: 0 0 20px 0; display: inline-block; vertical-align: middle; width: 100%;"
>
<a
target="_blank"
href="https://pikwizard.com/photo/global-financial-data-and-stock-market-analytics/4ba0255d1aa1289b48a73d7b13544de5/"
style="text-decoration: none; font-size: 10px; margin: 0;"
>
<img src="https://pikwizard.com/pw/medium/4ba0255d1aa1289b48a73d7b13544de5.jpg" style="margin: 0; width: 100%;" alt="" />
<p style="font-size: 12px; margin: 0;">PikWizard</p>
</a>
</span>
</span>
Free (free of charge)
Free for personal and commercial use.
Author: Authentic Images
Similar Free Stock Images

Premium


Premium


Premium


Premium

Premium


Premium


Premium


Premium


Premium

AI


Premium


Premium


Premium


Premium


Premium

Premium

Premium


Premium


Premium


Premium


Premium


Premium


Premium


Premium


Premium

Premium


Explore More Free Stock Images