
- Home >
- Stock Photos >
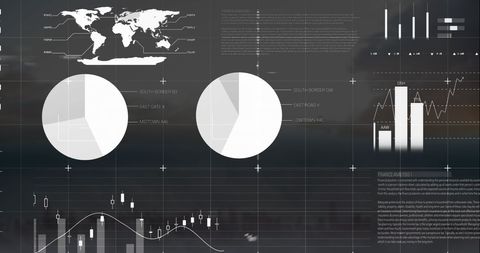
- Global Financial Data Chart and Graph Analysis Background
Global Financial Data Chart and Graph Analysis Background Image

Universal financial data intertwined with world map portrays global market perspective. Flux of charts and pie charts amidst data streams suits financial reports, presentations, and economic forums aiming to unveil vital insights of current financial situations. Digital graphics symbolize modernity in tracking economic changes, making it apt for use in technology startups, global business meetings, or corporate training sessions.
Powered by 


downloads
Tags:
More
Credit Photo
If you would like to credit the Photo, here are some ways you can do so
Text Link
photo Link
<span class="text-link">
<span>
<a target="_blank" href=https://pikwizard.com/photo/global-financial-data-chart-and-graph-analysis-background/95397a4251585dcacff06445cd7bb79e/>PikWizard</a>
</span>
</span>
<span class="image-link">
<span
style="margin: 0 0 20px 0; display: inline-block; vertical-align: middle; width: 100%;"
>
<a
target="_blank"
href="https://pikwizard.com/photo/global-financial-data-chart-and-graph-analysis-background/95397a4251585dcacff06445cd7bb79e/"
style="text-decoration: none; font-size: 10px; margin: 0;"
>
<img src="https://pikwizard.com/pw/medium/95397a4251585dcacff06445cd7bb79e.jpg" style="margin: 0; width: 100%;" alt="" />
<p style="font-size: 12px; margin: 0;">PikWizard</p>
</a>
</span>
</span>
Free (free of charge)
Free for personal and commercial use.
Author: Creative Art
Similar Free Stock Images

Premium

Premium

Premium


Premium


Premium


Premium


Premium


Premium


Premium


Premium


Premium


Premium


Premium


Premium

Premium

Premium


Premium


Premium


Premium


Premium

Premium


Premium


Premium

Premium


Premium

Explore More Free Stock Images