- Home >
- Stock Photos >
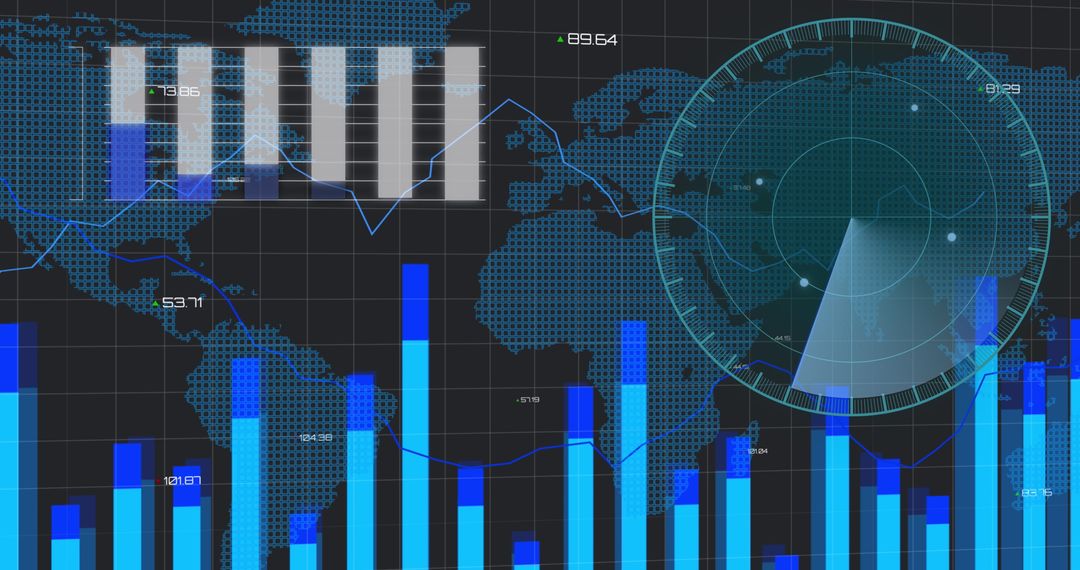
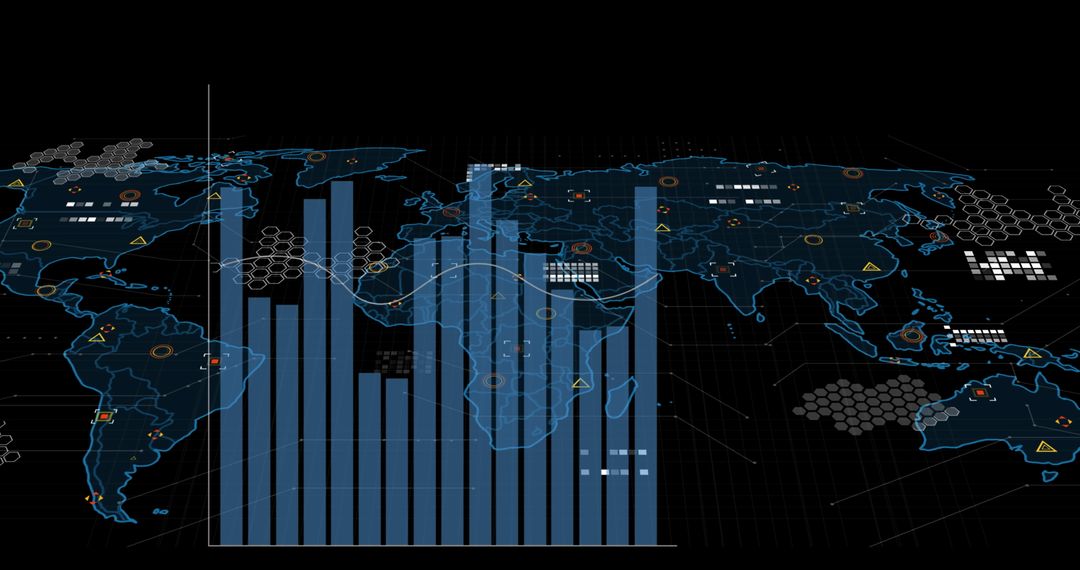
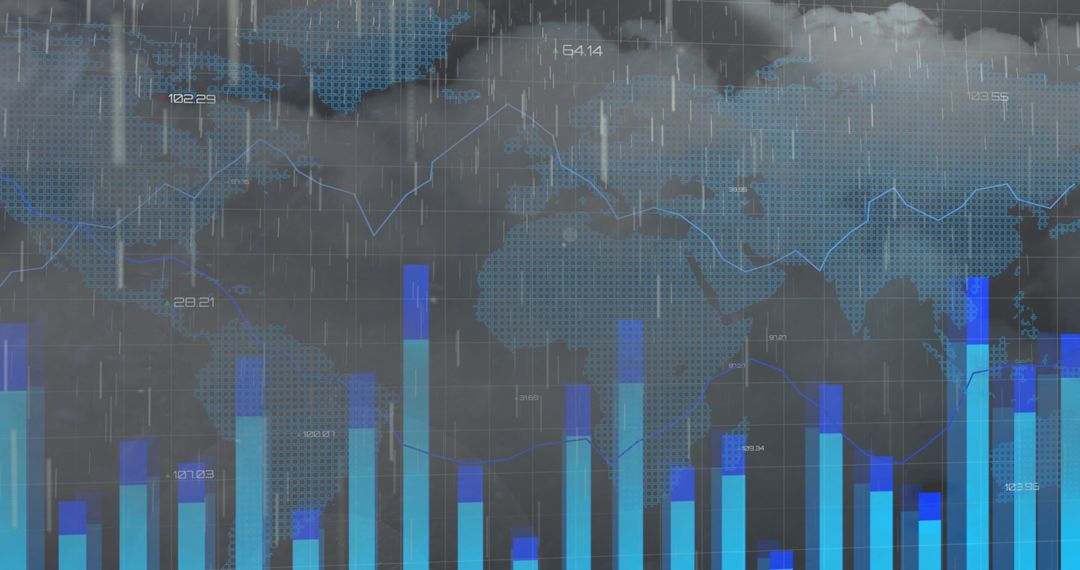
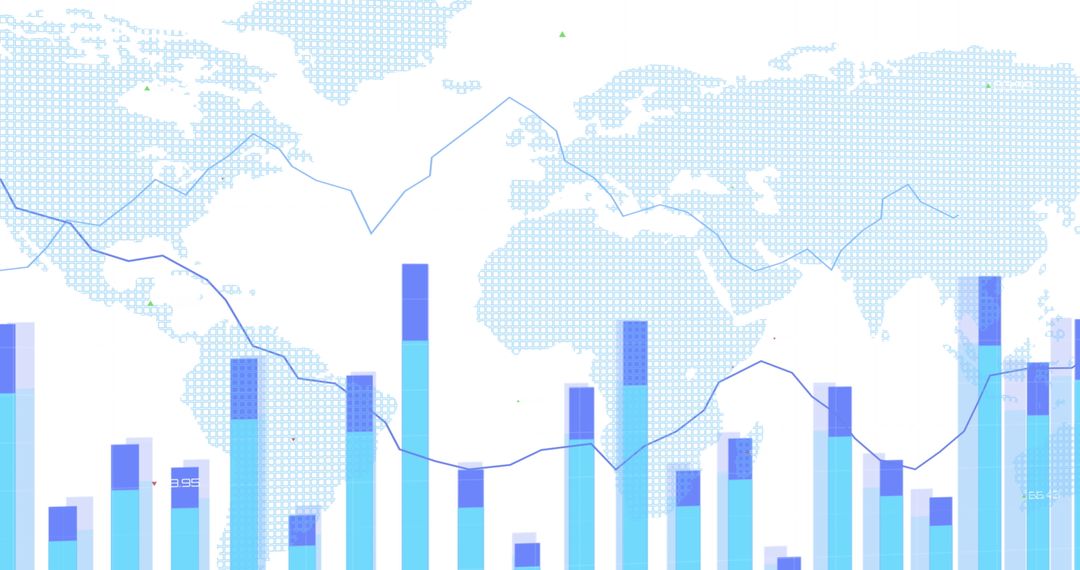
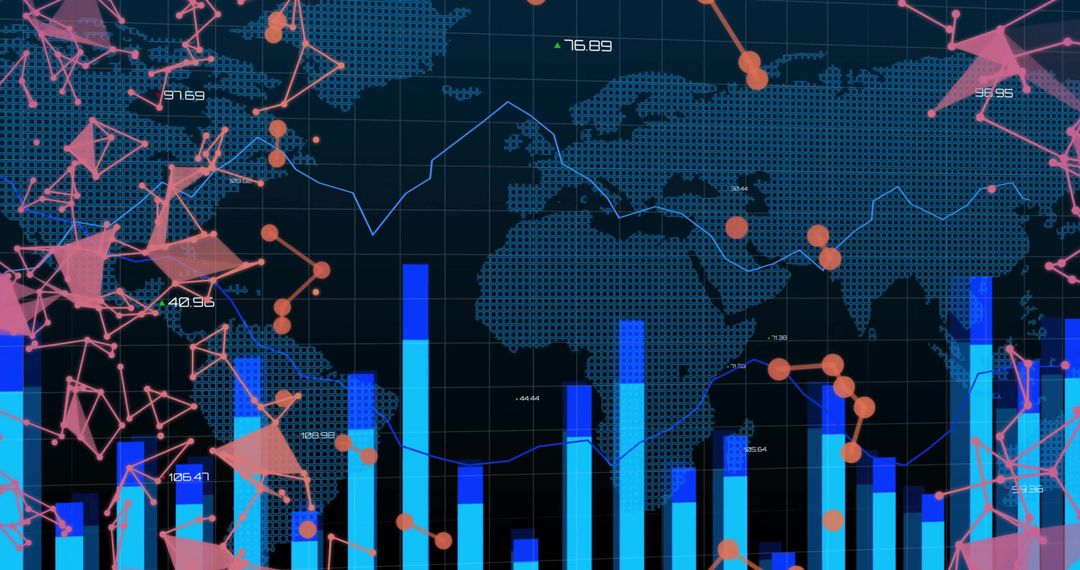
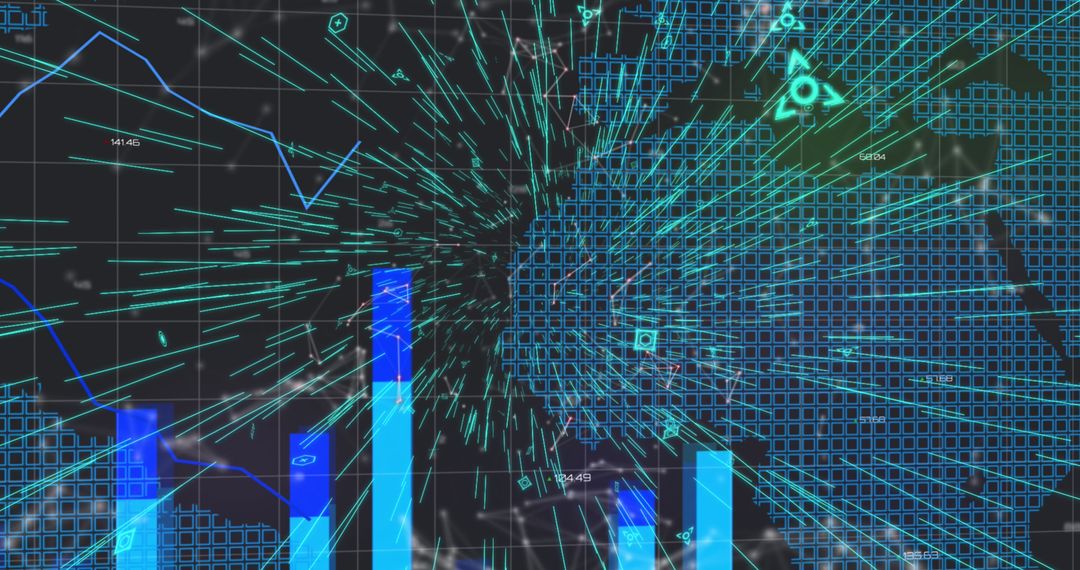
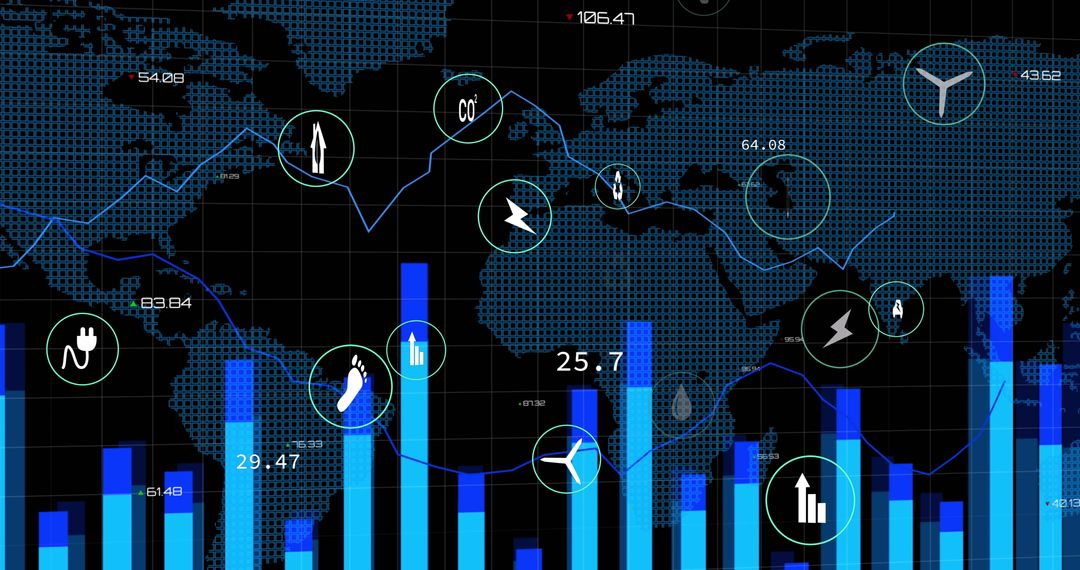
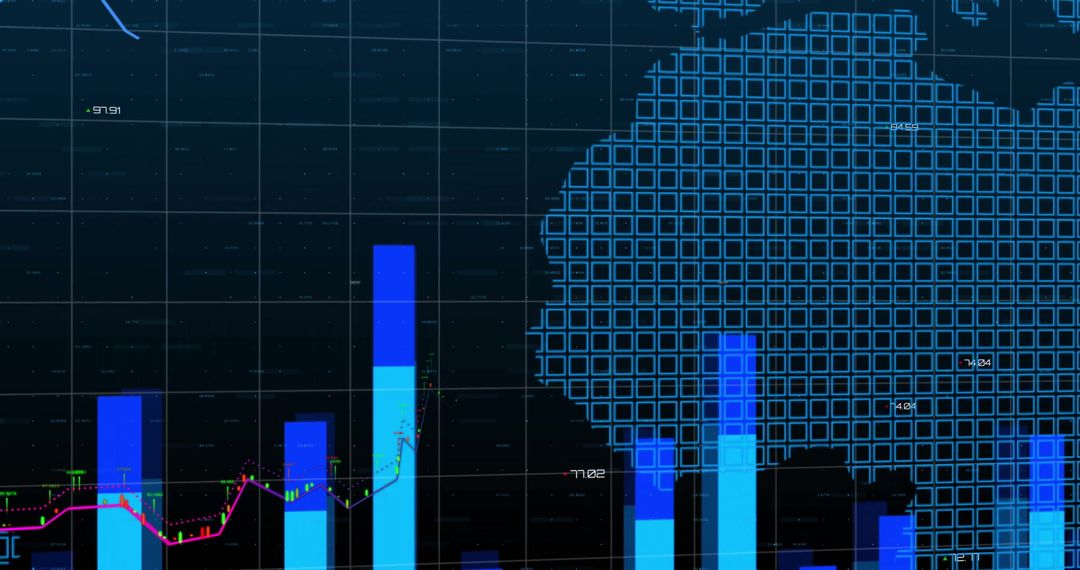
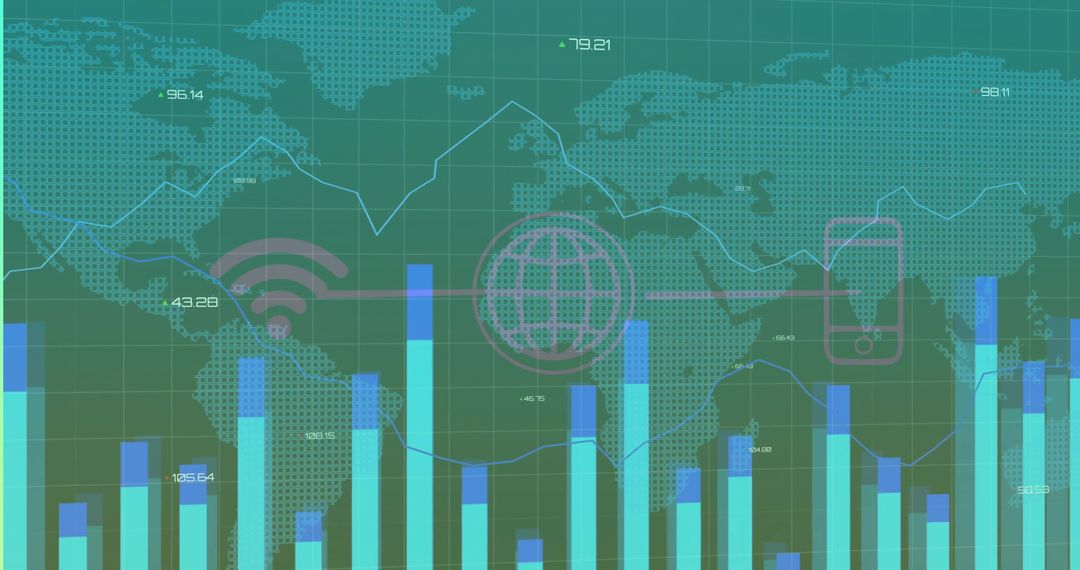
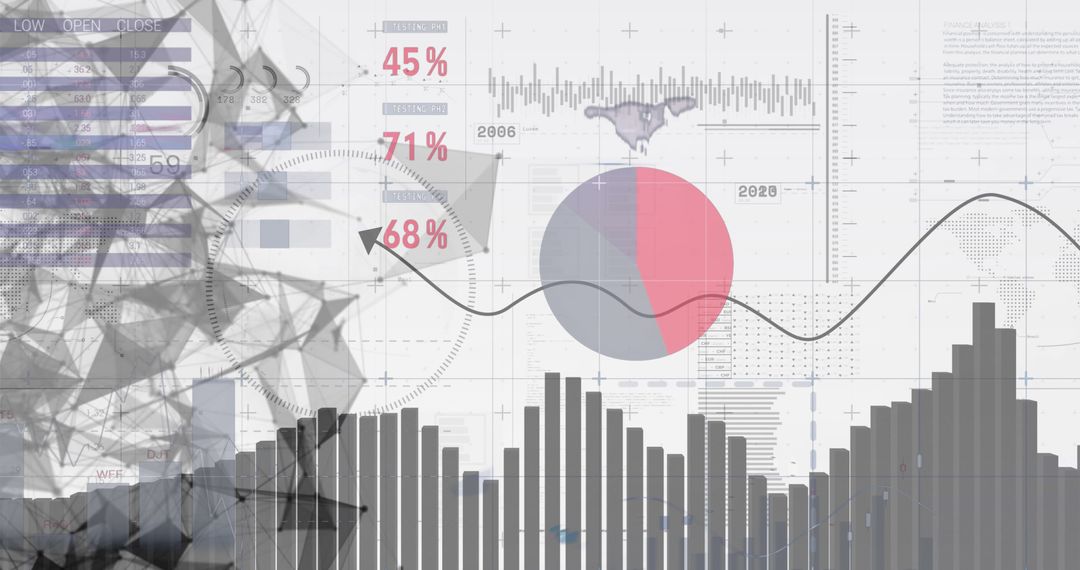
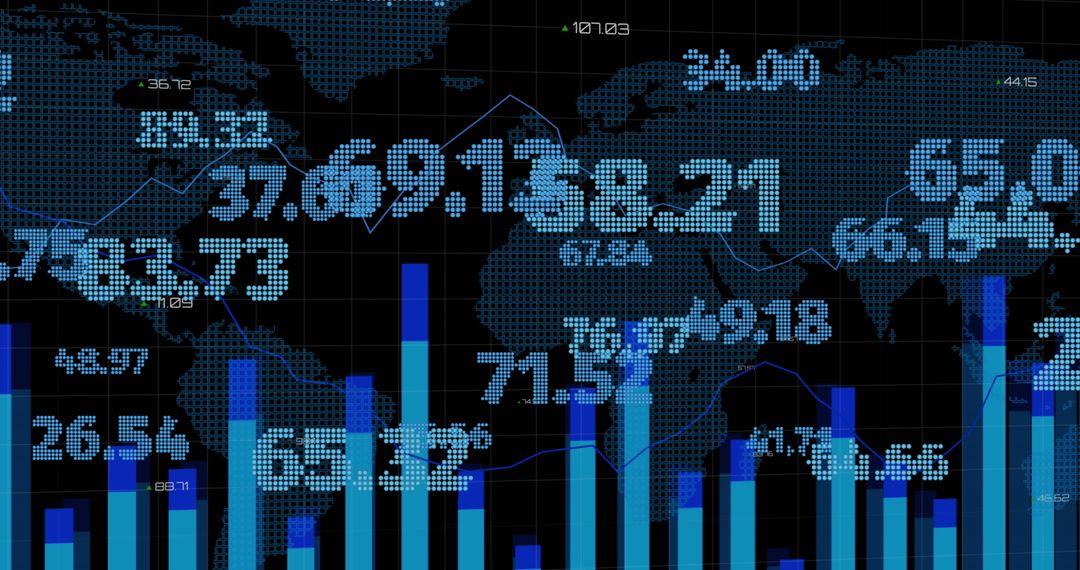
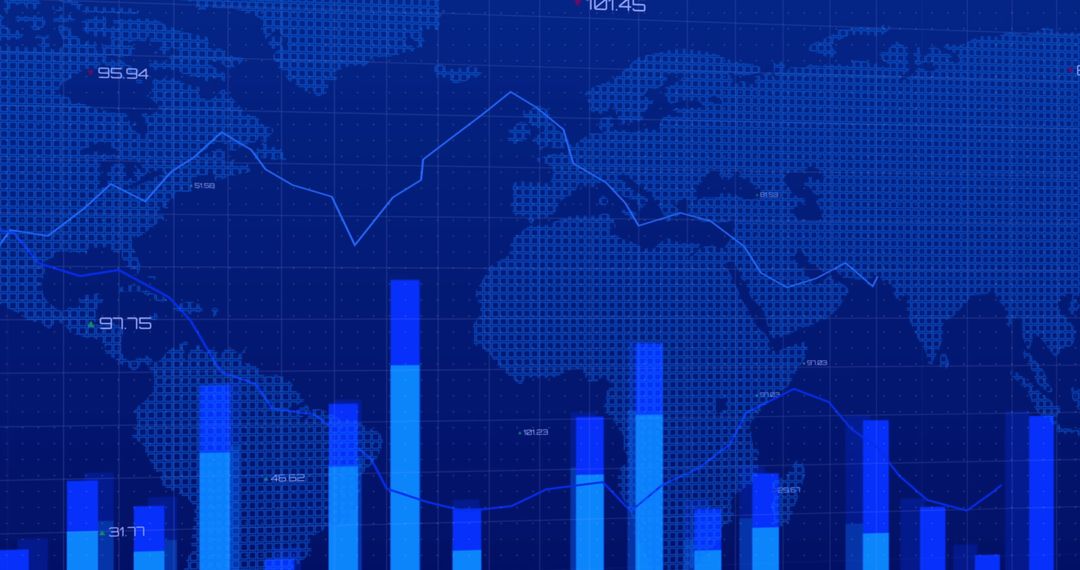
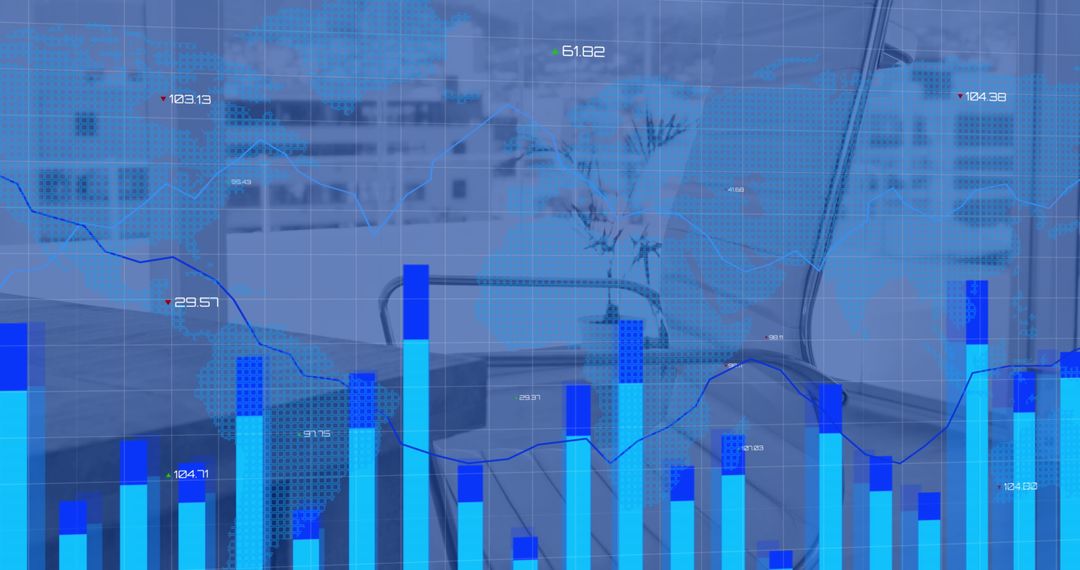
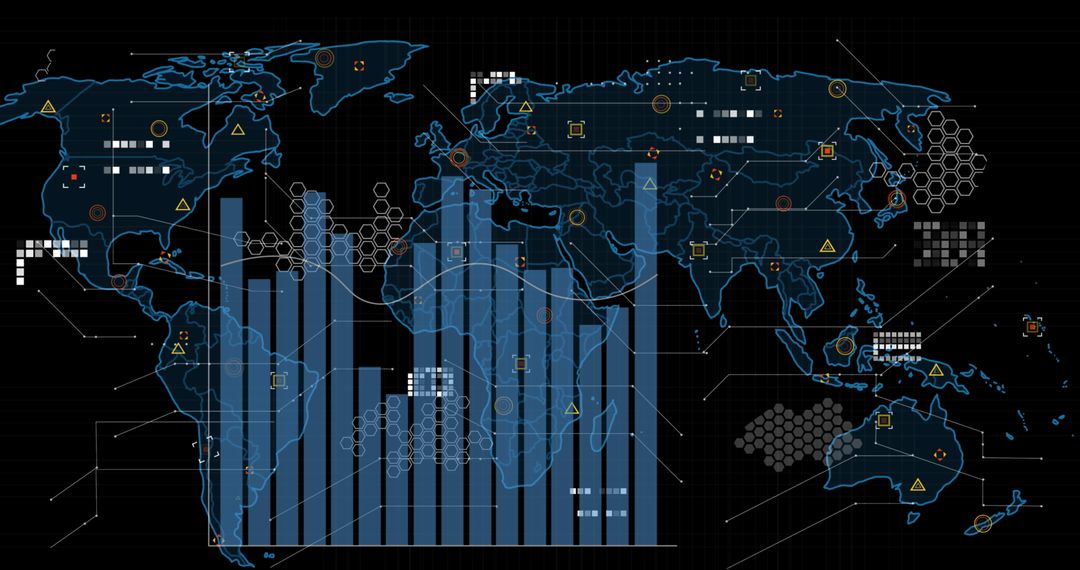
- Global Financial Data Dashboard Showing Interactive Bar Charts, Line Trends, and World Map
Global Financial Data Dashboard Showing Interactive Bar Charts, Line Trends, and World Map Image

Showing interactive global finance dashboard with tall vertical bars, layered line graphs, dotted world map background, glowing data points, grid overlays. Using cool blue neon palette for high-tech mood. Suitable for presenting market trends, quarterly results, investment reports, fintech branding, website hero visuals, corporate presentations, investor pitch decks, social media banners, blog headers, training materials. Working well for topics including stock market performance, global trade data, business intelligence, data science, algorithmic trading, financial technology. Providing clear negative space for overlaying text, logos, KPI callouts. Delivering modern professional visual for commercial use.
Powered by 


0
downloads
downloads
Tags:
More
Credit Photo
If you would like to credit the Photo, here are some ways you can do so
Text Link
photo Link
<span class="text-link">
<span>
<a target="_blank" href=https://pikwizard.com/photo/global-financial-data-dashboard-showing-interactive-bar-charts-line-trends-and-world-map/14da7e9c475cd98fd5612ad0751f3c61/>PikWizard</a>
</span>
</span>
<span class="image-link">
<span
style="margin: 0 0 20px 0; display: inline-block; vertical-align: middle; width: 100%;"
>
<a
target="_blank"
href="https://pikwizard.com/photo/global-financial-data-dashboard-showing-interactive-bar-charts-line-trends-and-world-map/14da7e9c475cd98fd5612ad0751f3c61/"
style="text-decoration: none; font-size: 10px; margin: 0;"
>
<img src="https://pikwizard.com/pw/medium/14da7e9c475cd98fd5612ad0751f3c61.jpg" style="margin: 0; width: 100%;" alt="" />
<p style="font-size: 12px; margin: 0;">PikWizard</p>
</a>
</span>
</span>
Free (free of charge)
Free for personal and commercial use.
Author: Creative Art
Similar Free Stock Images
Premium


Premium


Premium


Premium


Premium


Premium


Premium


Premium


Premium


Premium


Premium


Premium


Premium


Premium


Premium


Premium


Premium


Premium

Premium


Premium


Premium

Premium


Premium


Premium