
- Home >
- Stock Photos >
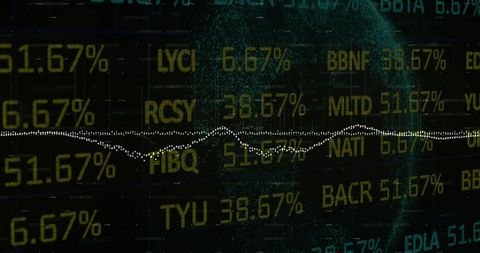
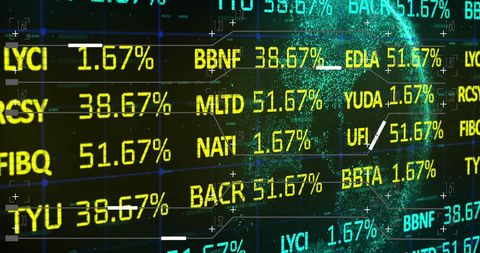
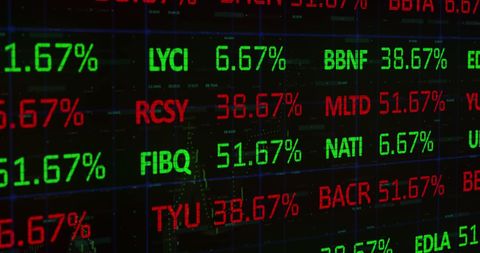
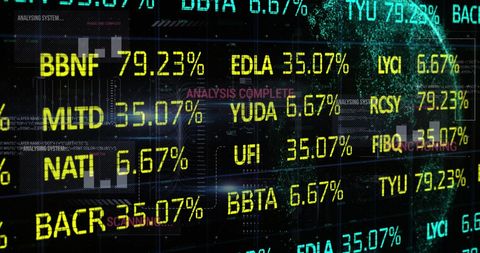
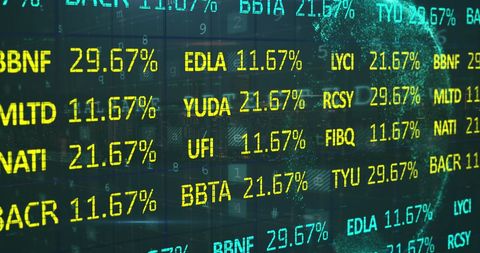
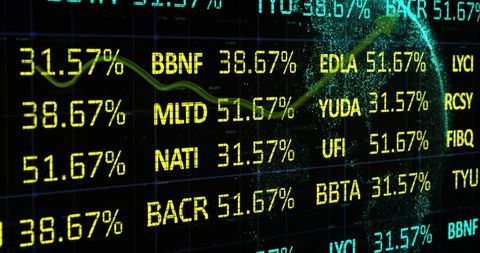
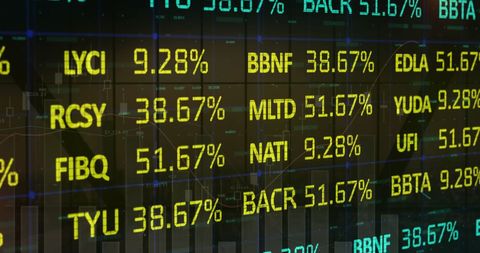
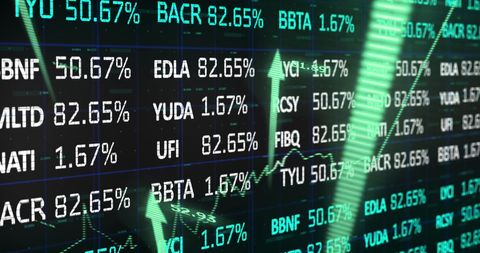
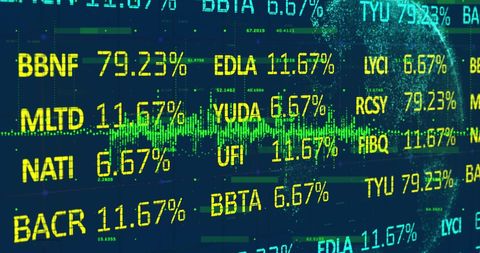
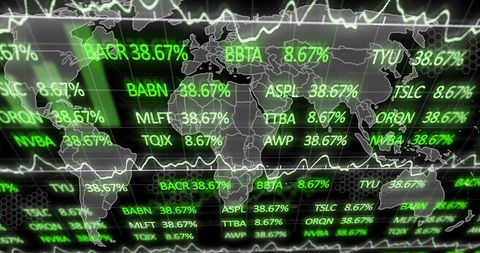
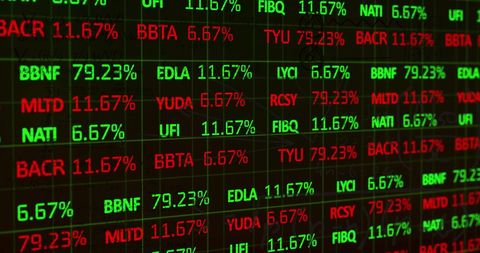
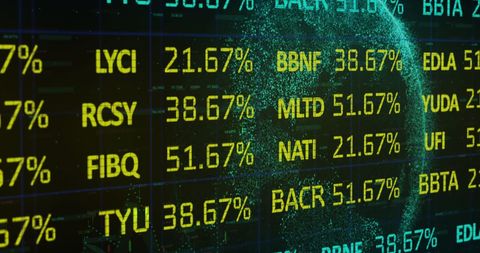
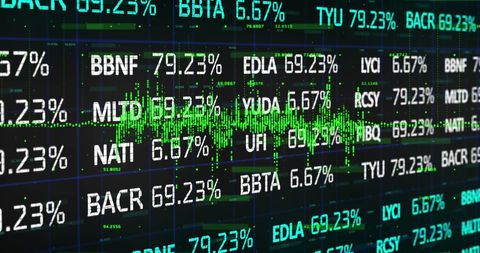
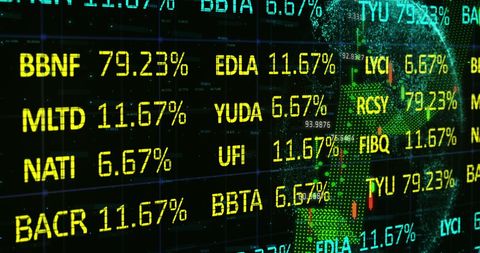
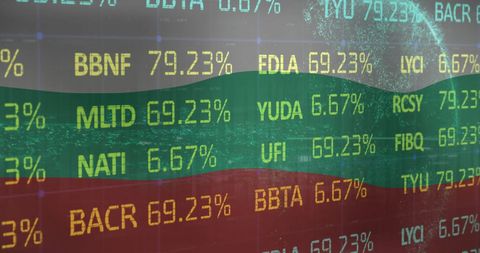
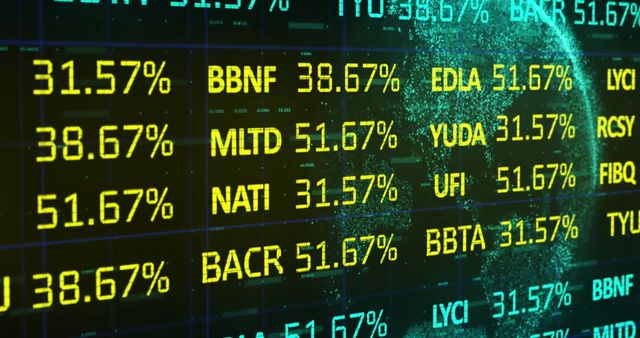
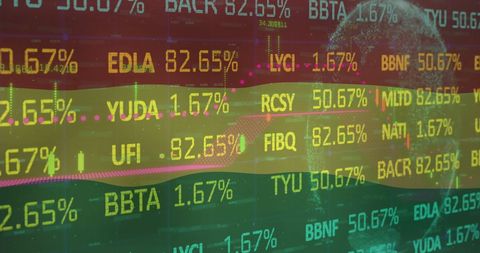
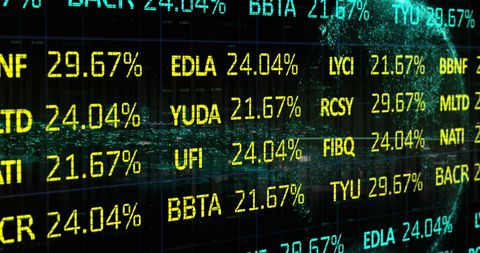
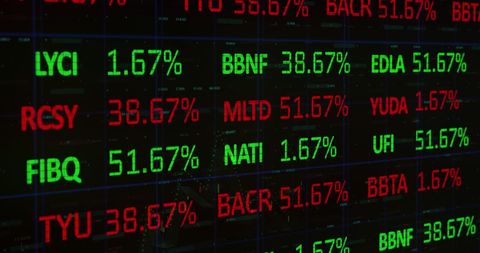
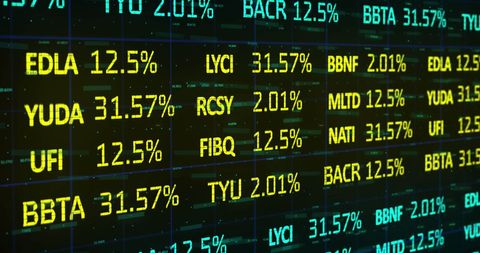
- Global Financial Data Display on Digital Interface
Global Financial Data Display on Digital Interface Image
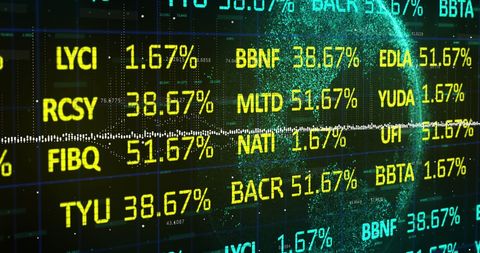
Digital display of financial data, showcasing various stock indexes and percentages on globe background. Useful for illustrating concepts related to global finance, stock trading, investment analytics, and economic trends. Ideal for presentations, educational materials, or marketing content focusing on technology in finance.
Powered by 


downloads
Tags:
More
Credit Photo
If you would like to credit the Photo, here are some ways you can do so
Text Link
photo Link
<span class="text-link">
<span>
<a target="_blank" href=https://pikwizard.com/photo/global-financial-data-display-on-digital-interface/8aeba516f1f7eeab12087fea87775084/>PikWizard</a>
</span>
</span>
<span class="image-link">
<span
style="margin: 0 0 20px 0; display: inline-block; vertical-align: middle; width: 100%;"
>
<a
target="_blank"
href="https://pikwizard.com/photo/global-financial-data-display-on-digital-interface/8aeba516f1f7eeab12087fea87775084/"
style="text-decoration: none; font-size: 10px; margin: 0;"
>
<img src="https://pikwizard.com/pw/medium/8aeba516f1f7eeab12087fea87775084.jpg" style="margin: 0; width: 100%;" alt="" />
<p style="font-size: 12px; margin: 0;">PikWizard</p>
</a>
</span>
</span>
Free (free of charge)
Free for personal and commercial use.
Author: Creative Art
Similar Free Stock Images

Premium


Premium


Premium


Premium


Premium


Premium


Premium


Premium


Premium


Premium


Premium

Premium

Premium

Premium


Premium

Premium


Premium

Premium

Premium

Premium

Premium


Premium

Premium

Premium

Premium


Explore More Free Stock Images