
- Home >
- Stock Photos >
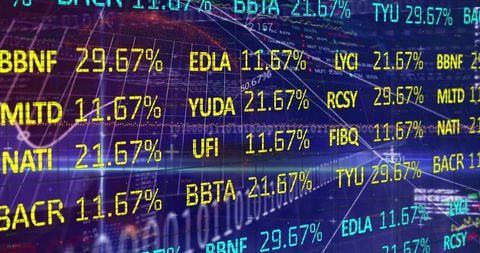
- Global Financial Data Displayed with Dynamic Interfaces
Global Financial Data Displayed with Dynamic Interfaces Image

This visual represents the complex interface of global finance data and stock markets, featuring a world map overlaid with dynamic digits and graphical elements. This concept can be utilized for presentations on economic strategies, data analytics workshops, and digital interface designs in financial technology. The image suits articles and discussions relating to international stock market analysis, automated data processing, and economic forecasting trends.
Powered by 


downloads
Tags:
More
Credit Photo
If you would like to credit the Photo, here are some ways you can do so
Text Link
photo Link
<span class="text-link">
<span>
<a target="_blank" href=https://pikwizard.com/photo/global-financial-data-displayed-with-dynamic-interfaces/5a42bf27789a1dffd6fe93d50ff6b090/>PikWizard</a>
</span>
</span>
<span class="image-link">
<span
style="margin: 0 0 20px 0; display: inline-block; vertical-align: middle; width: 100%;"
>
<a
target="_blank"
href="https://pikwizard.com/photo/global-financial-data-displayed-with-dynamic-interfaces/5a42bf27789a1dffd6fe93d50ff6b090/"
style="text-decoration: none; font-size: 10px; margin: 0;"
>
<img src="https://pikwizard.com/pw/medium/5a42bf27789a1dffd6fe93d50ff6b090.jpg" style="margin: 0; width: 100%;" alt="" />
<p style="font-size: 12px; margin: 0;">PikWizard</p>
</a>
</span>
</span>
Free (free of charge)
Free for personal and commercial use.
Author: Authentic Images
Similar Free Stock Images

Premium


Premium


Premium

Premium


Premium


Premium


Premium


Premium


Premium


Premium


Premium


Premium


Premium


Premium

Premium

Premium


Premium


Premium


Premium

Premium


Premium


Premium


Premium

Premium


Premium

Explore More Free Stock Images