
- Home >
- Stock Photos >
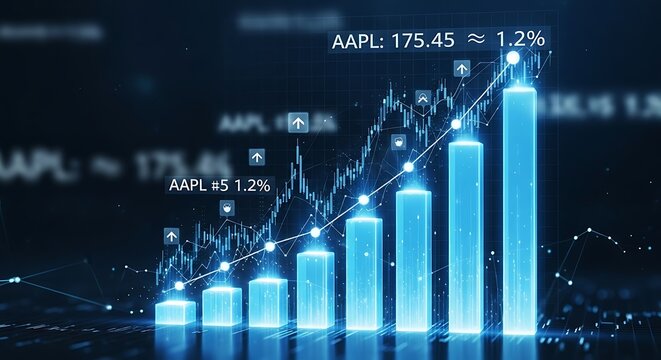
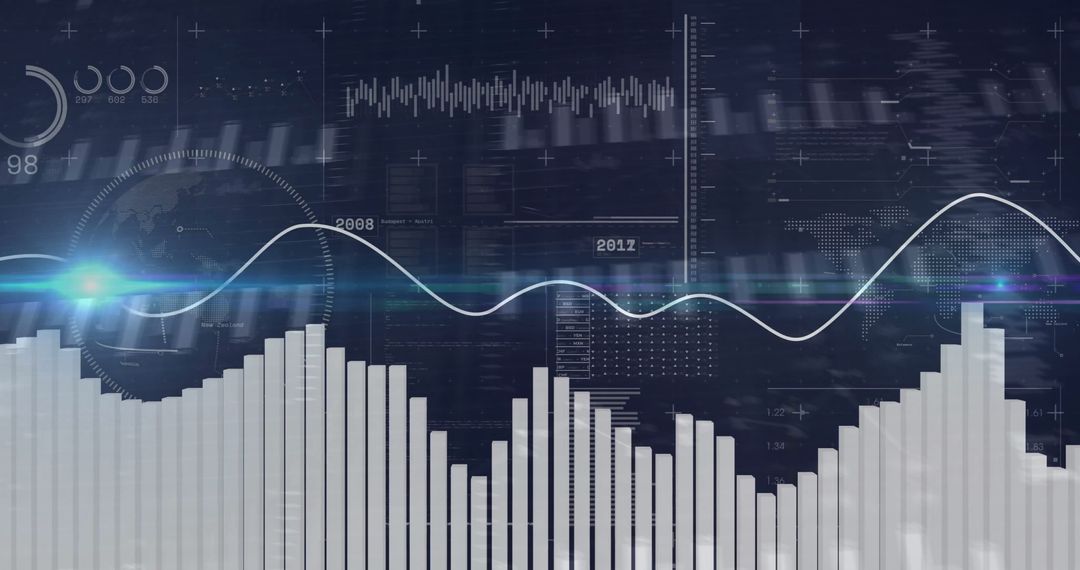
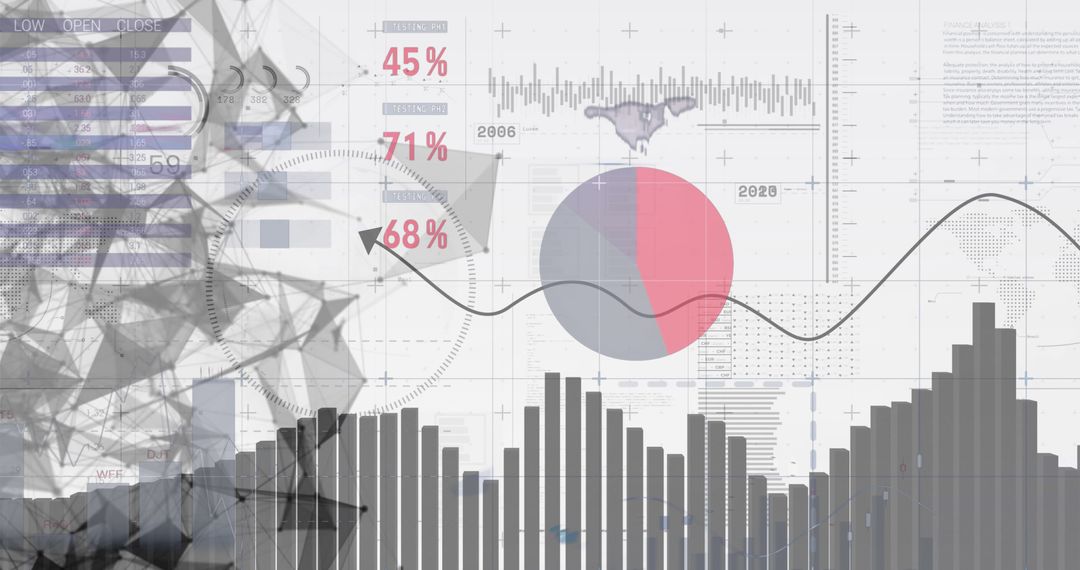
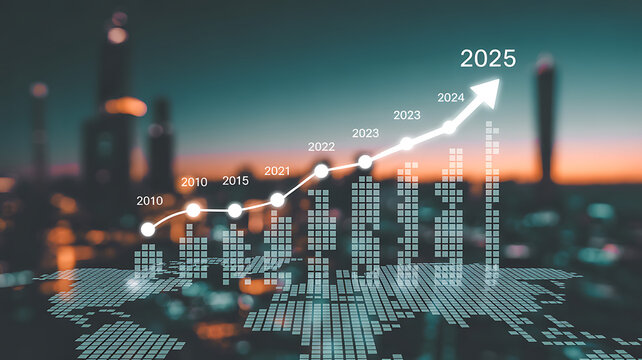
- Global Financial Data Interaction and Digital Analytics
Global Financial Data Interaction and Digital Analytics Image

Digital illustration showcasing intertwined financial data streams alongside global and economic markers, creating an innovative representation ideal for discussing financial forecasting, global market trends, or digital finance tools. Could enhance business reports, finance-related presentations, or educational content regarding economic growth strategies.
Powered by 


0
downloads
downloads
Tags:
More
Credit Photo
If you would like to credit the Photo, here are some ways you can do so
Text Link
photo Link
<span class="text-link">
<span>
<a target="_blank" href=https://pikwizard.com/photo/global-financial-data-interaction-and-digital-analytics/09317f737679c863a72493f595882399/>PikWizard</a>
</span>
</span>
<span class="image-link">
<span
style="margin: 0 0 20px 0; display: inline-block; vertical-align: middle; width: 100%;"
>
<a
target="_blank"
href="https://pikwizard.com/photo/global-financial-data-interaction-and-digital-analytics/09317f737679c863a72493f595882399/"
style="text-decoration: none; font-size: 10px; margin: 0;"
>
<img src="https://pikwizard.com/pw/medium/09317f737679c863a72493f595882399.jpg" style="margin: 0; width: 100%;" alt="" />
<p style="font-size: 12px; margin: 0;">PikWizard</p>
</a>
</span>
</span>
Free (free of charge)
Free for personal and commercial use.
Author: Awesome Content
Similar Free Stock Images

Premium


Premium


Premium


Premium


Premium


Premium


Premium


Premium


Premium


Premium


Premium


Premium


Premium


Premium


Premium


Premium


Premium


Premium


Premium


Premium


Premium


Premium


Premium

Premium

