- Home >
- Stock Photos >
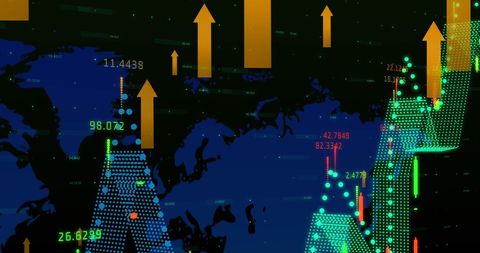
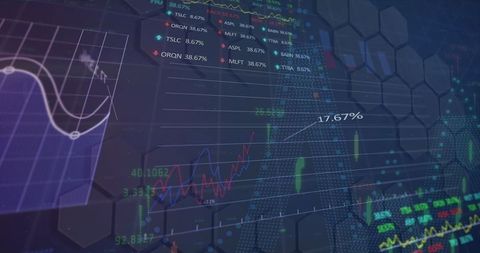
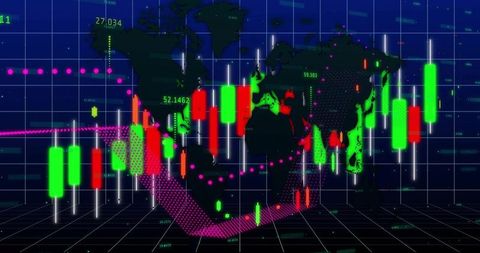
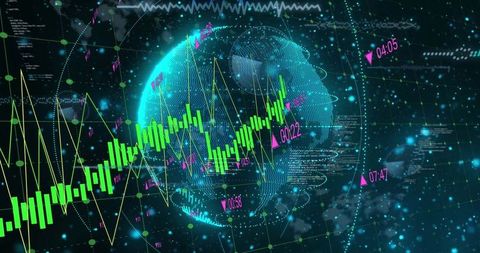
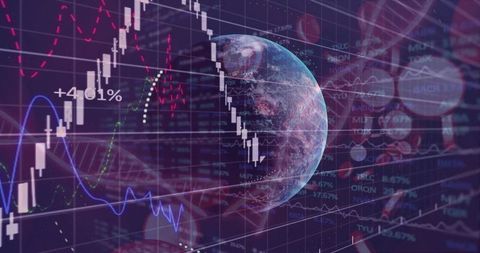
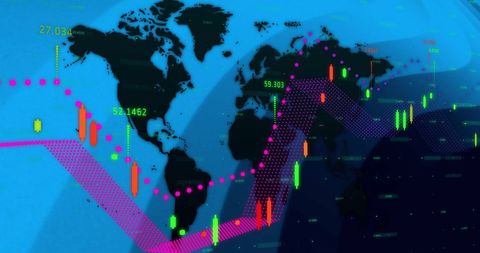
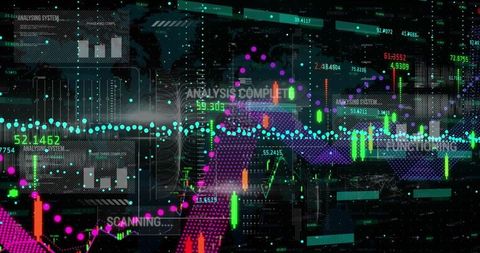
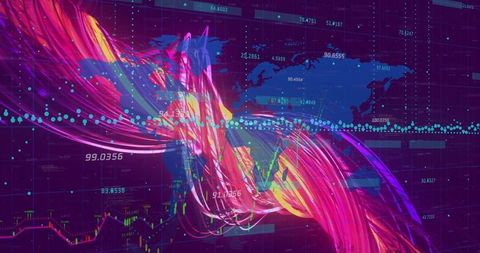
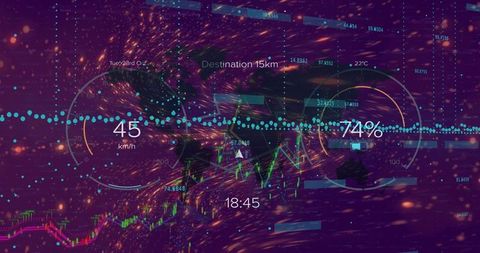
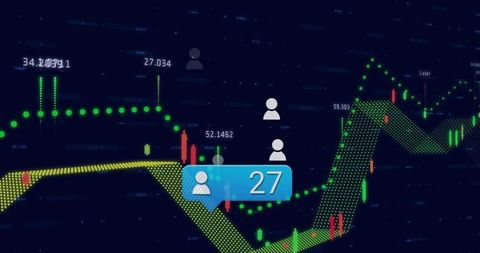
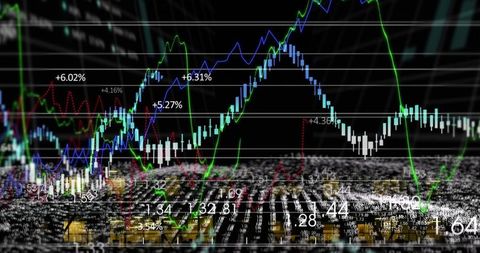
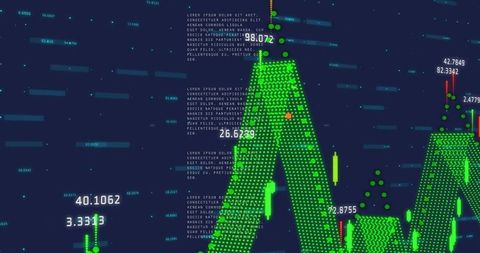
- Global Financial Data Interface Analyzing Candlestick Charts
Global Financial Data Interface Analyzing Candlestick Charts Image
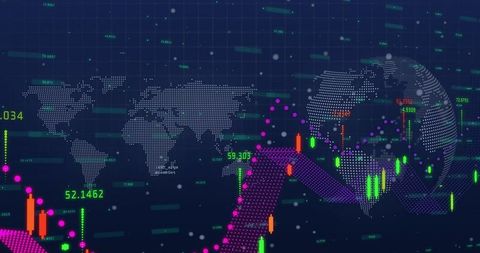
Dynamic design showcasing global financial data interface integrating candlestick charts and digital analytics. This depiction emphasizes finance, business intelligence, and innovative data visualization. Ideal for illustrating articles on digital financial tools, global economic trends, or advanced data analysis technologies.

downloads
Tags:
More
Credit Photo
If you would like to credit the Photo, here are some ways you can do so
Text Link
photo Link
<span class="text-link">
<span>
<a target="_blank" href=https://pikwizard.com/photo/global-financial-data-interface-analyzing-candlestick-charts/aeaecac330321a1bffd264e260499db5/>PikWizard</a>
</span>
</span>
<span class="image-link">
<span
style="margin: 0 0 20px 0; display: inline-block; vertical-align: middle; width: 100%;"
>
<a
target="_blank"
href="https://pikwizard.com/photo/global-financial-data-interface-analyzing-candlestick-charts/aeaecac330321a1bffd264e260499db5/"
style="text-decoration: none; font-size: 10px; margin: 0;"
>
<img src="https://pikwizard.com/pw/medium/aeaecac330321a1bffd264e260499db5.jpg" style="margin: 0; width: 100%;" alt="" />
<p style="font-size: 12px; margin: 0;">PikWizard</p>
</a>
</span>
</span>
Free (free of charge)
Free for personal and commercial use.
Author: Awesome Content