
- Home >
- Stock Photos >
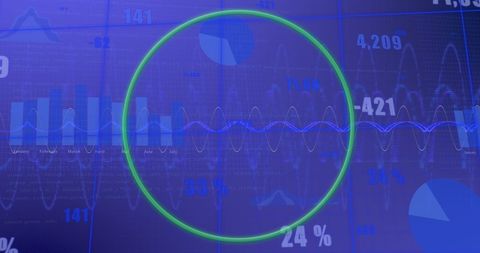
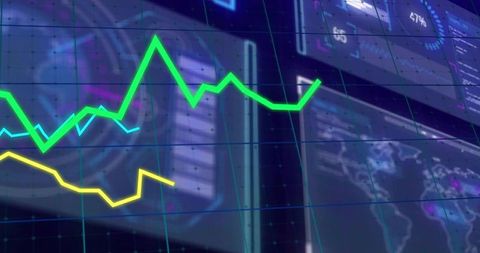
- Global Financial Data Interface with Uptrending Arrow
Global Financial Data Interface with Uptrending Arrow Image
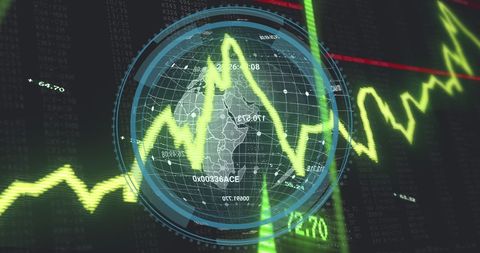
Dynamic visualization depicting global financial data with an uptrending arrow, symbolizing economic growth and progress within an interconnected global network. The digital interface presents a futuristic perspective on finance, making it ideal for use in finance blogs, technology presentations, and global economic analyses. Perfect for illustrating articles related to market trends, digital transformation in financial sectors, and forecasting financial growth scenarios.
Powered by 


downloads
Tags:
More
Credit Photo
If you would like to credit the Photo, here are some ways you can do so
Text Link
photo Link
<span class="text-link">
<span>
<a target="_blank" href=https://pikwizard.com/photo/global-financial-data-interface-with-uptrending-arrow/87b0fb6cc15db5c91db33054f18256ed/>PikWizard</a>
</span>
</span>
<span class="image-link">
<span
style="margin: 0 0 20px 0; display: inline-block; vertical-align: middle; width: 100%;"
>
<a
target="_blank"
href="https://pikwizard.com/photo/global-financial-data-interface-with-uptrending-arrow/87b0fb6cc15db5c91db33054f18256ed/"
style="text-decoration: none; font-size: 10px; margin: 0;"
>
<img src="https://pikwizard.com/pw/medium/87b0fb6cc15db5c91db33054f18256ed.jpg" style="margin: 0; width: 100%;" alt="" />
<p style="font-size: 12px; margin: 0;">PikWizard</p>
</a>
</span>
</span>
Free (free of charge)
Free for personal and commercial use.
Author: Awesome Content
Similar Free Stock Images

Premium


Premium


Premium

Premium


Premium


Premium


Premium


Premium


Premium


Premium


Premium


Premium


Premium

Premium

Premium


Premium


Premium


Premium


Premium

Premium

Premium


Premium


Premium


Premium


Premium


Explore More Free Stock Images