- Home >
- Stock Photos >
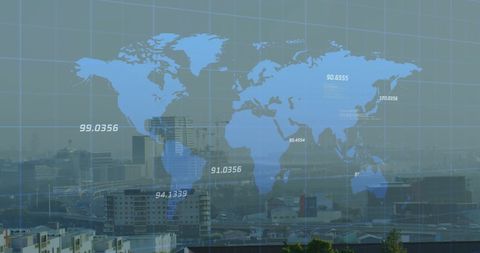
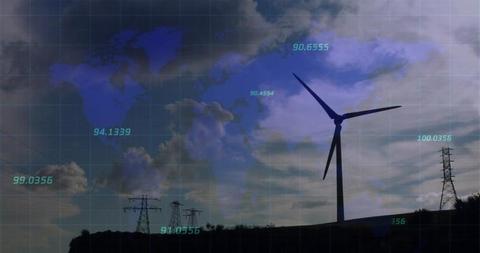
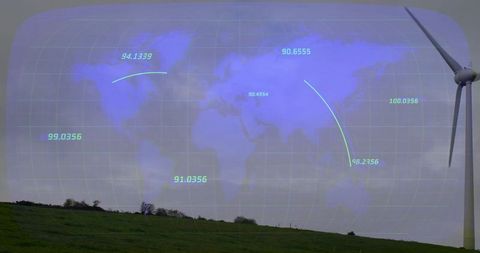
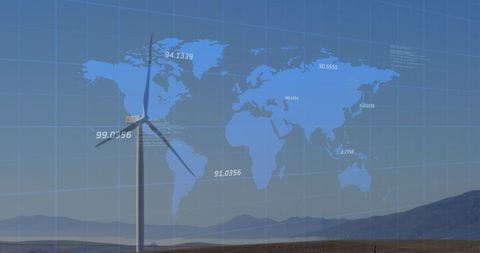
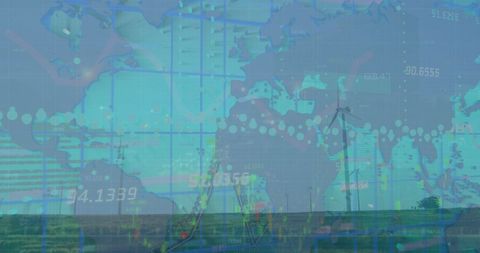
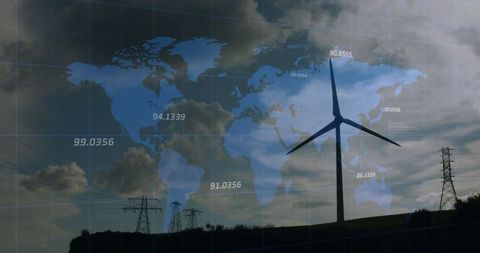
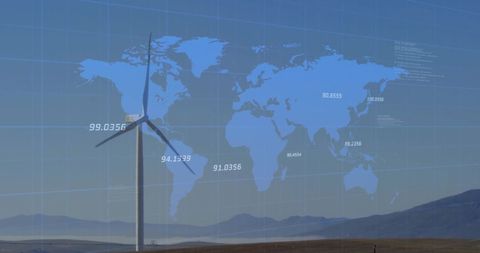
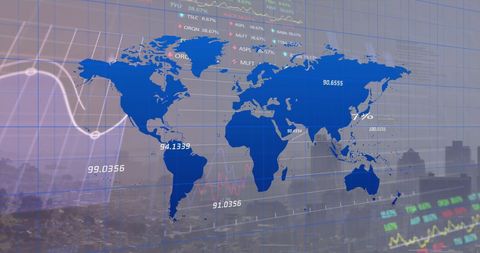
- Global Financial Data on Digital World Map
Global Financial Data on Digital World Map Image

Depicts global financial data overlapping digital world map, representing interconnected economy and stock market analytics. Useful for illustrating concepts of global finance, data-driven investment strategies, and economic globalization in reports, presentations, and financial models.

downloads
Tags:
More
Credit Photo
If you would like to credit the Photo, here are some ways you can do so
Text Link
photo Link
<span class="text-link">
<span>
<a target="_blank" href=https://pikwizard.com/photo/global-financial-data-on-digital-world-map/2f943face64510088fb598b4f7b00dc7/>PikWizard</a>
</span>
</span>
<span class="image-link">
<span
style="margin: 0 0 20px 0; display: inline-block; vertical-align: middle; width: 100%;"
>
<a
target="_blank"
href="https://pikwizard.com/photo/global-financial-data-on-digital-world-map/2f943face64510088fb598b4f7b00dc7/"
style="text-decoration: none; font-size: 10px; margin: 0;"
>
<img src="https://pikwizard.com/pw/medium/2f943face64510088fb598b4f7b00dc7.jpg" style="margin: 0; width: 100%;" alt="" />
<p style="font-size: 12px; margin: 0;">PikWizard</p>
</a>
</span>
</span>
Free (free of charge)
Free for personal and commercial use.
Author: Authentic Images