- Home >
- Stock Photos >
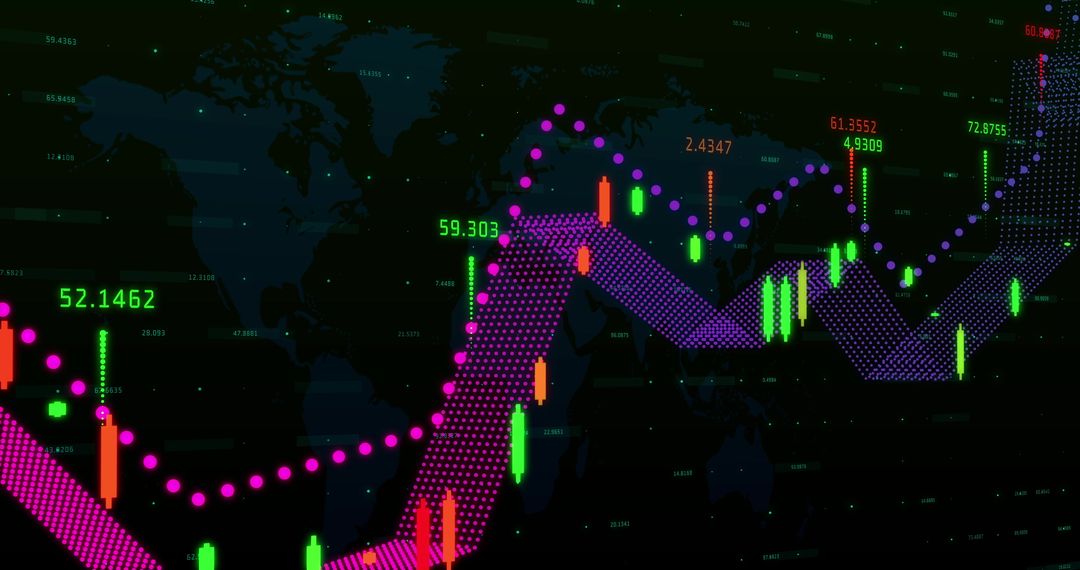
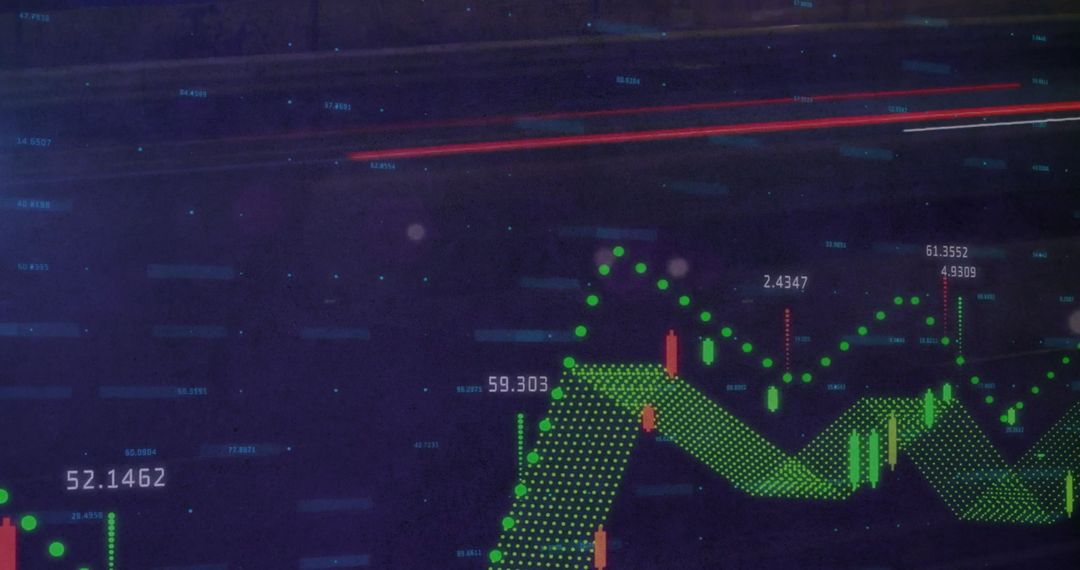
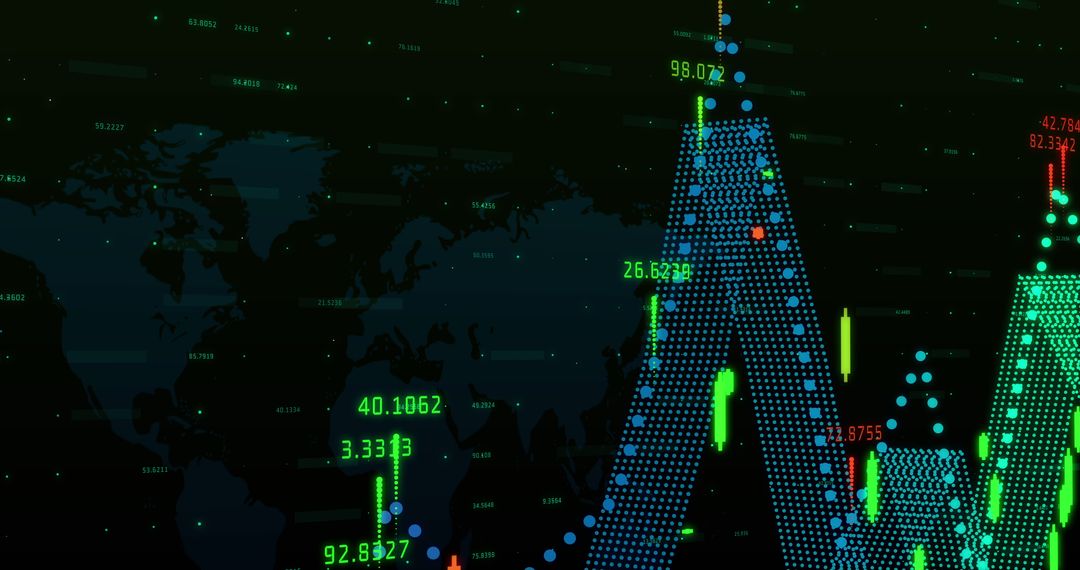
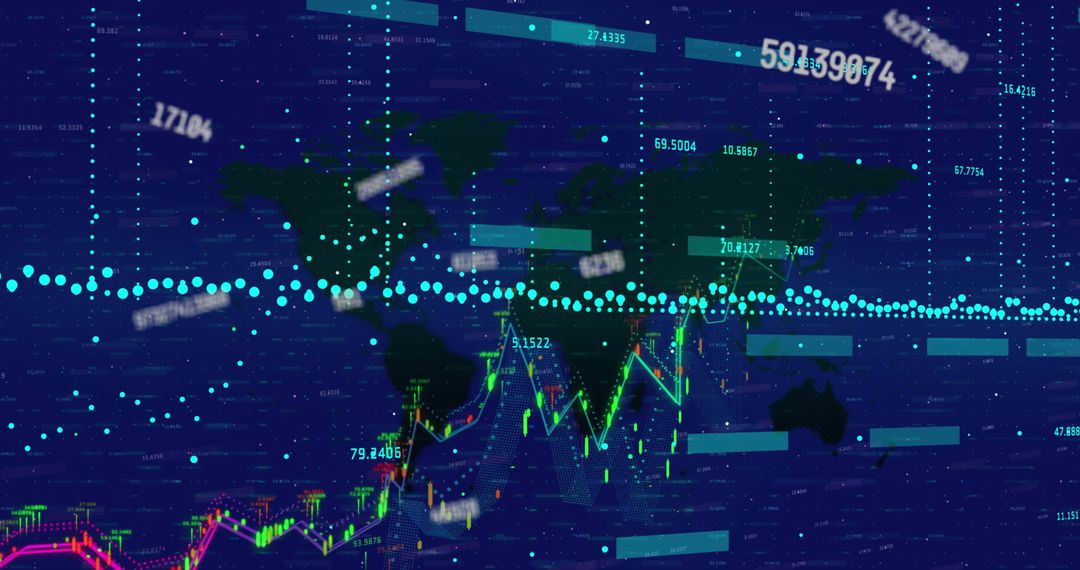
- Global Financial Data Overlay on Digital World Map
Global Financial Data Overlay on Digital World Map Image

Illustration showing financial trends with graphs and numbers projected over a digital world map. Ideal for use in presentations or articles on global finance, stock market analysis, investment strategy, and financial news outlets. Conveys a sense of technological sophistication and connectivity in global business endeavors.
Powered by  - Get 15% off with code: PIKWIZARD15


2
downloads
downloads
Tags:
More
Credit Photo
If you would like to credit the Photo, here are some ways you can do so
Text Link
photo Link
<span class="text-link">
<span>
<a target="_blank" href=https://pikwizard.com/photo/global-financial-data-overlay-on-digital-world-map/2b3714fba588a6ec5c18429afdbd5796/>PikWizard</a>
</span>
</span>
<span class="image-link">
<span
style="margin: 0 0 20px 0; display: inline-block; vertical-align: middle; width: 100%;"
>
<a
target="_blank"
href="https://pikwizard.com/photo/global-financial-data-overlay-on-digital-world-map/2b3714fba588a6ec5c18429afdbd5796/"
style="text-decoration: none; font-size: 10px; margin: 0;"
>
<img src="https://pikwizard.com/pw/medium/2b3714fba588a6ec5c18429afdbd5796.jpg" style="margin: 0; width: 100%;" alt="" />
<p style="font-size: 12px; margin: 0;">PikWizard</p>
</a>
</span>
</span>
Free (free of charge)
Free for personal and commercial use.
Author: Creative Art
Similar Free Stock Images
Premium


Premium


Premium


Premium


Premium


Premium


Premium


Premium


Premium


Premium


Premium


Premium


Premium


Premium


Premium


Premium


Premium


Premium


Premium


Premium


Premium


Premium


Premium


Premium