- Home >
- Stock Photos >
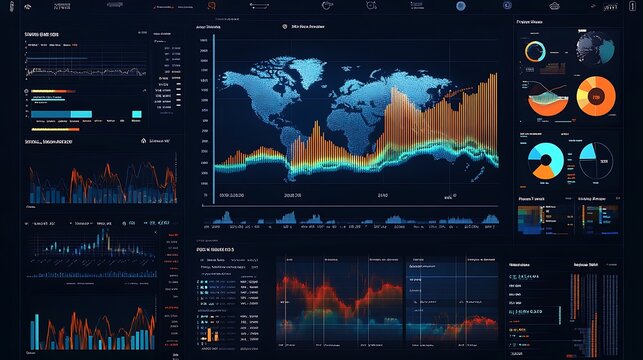
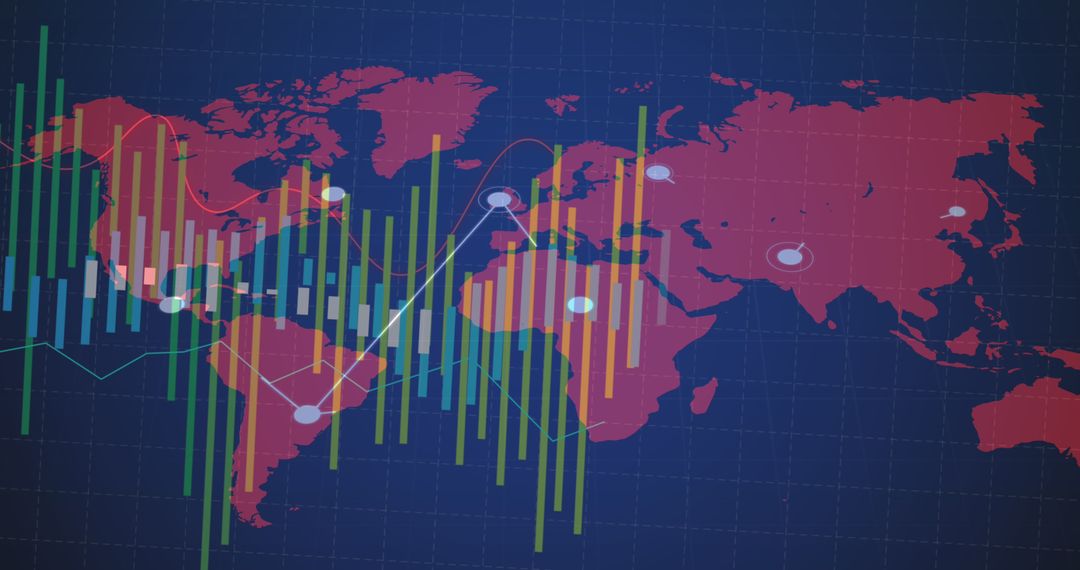
- Global Financial Data Overlay on World Map for Business Analysis
Global Financial Data Overlay on World Map for Business Analysis Image

The image displays a digital overlay of financial data charts on a world map background, symbolizing global business and economic analysis. Vertical bars and graph lines show different financial metrics, which suggest connections and data trends. Useful for illustrating global finances, business strategy, and economic forecasts in presentations, reports, or articles related to economic trends and data analysis.
Powered by 


0
downloads
downloads
Tags:
More
Credit Photo
If you would like to credit the Photo, here are some ways you can do so
Text Link
photo Link
<span class="text-link">
<span>
<a target="_blank" href=https://pikwizard.com/photo/global-financial-data-overlay-on-world-map-for-business-analysis/eb51dc770e3360d602b4c5dc60e50d02/>PikWizard</a>
</span>
</span>
<span class="image-link">
<span
style="margin: 0 0 20px 0; display: inline-block; vertical-align: middle; width: 100%;"
>
<a
target="_blank"
href="https://pikwizard.com/photo/global-financial-data-overlay-on-world-map-for-business-analysis/eb51dc770e3360d602b4c5dc60e50d02/"
style="text-decoration: none; font-size: 10px; margin: 0;"
>
<img src="https://pikwizard.com/pw/medium/eb51dc770e3360d602b4c5dc60e50d02.jpg" style="margin: 0; width: 100%;" alt="" />
<p style="font-size: 12px; margin: 0;">PikWizard</p>
</a>
</span>
</span>
Free (free of charge)
Free for personal and commercial use.
Author: Creative Art
Similar Free Stock Images

Premium


Premium


Premium


Premium


Premium


Premium


Premium


Premium


Premium


Premium


Premium


Premium


Premium


Premium


Premium


Premium


Premium


Premium


Premium


Premium


Premium


Premium


Premium


Premium