- Home >
- Stock Photos >
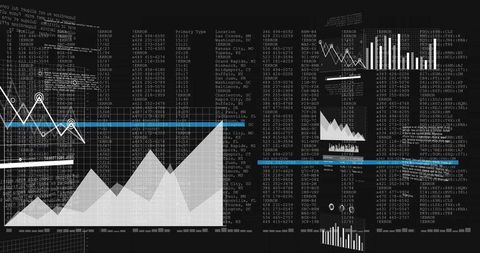
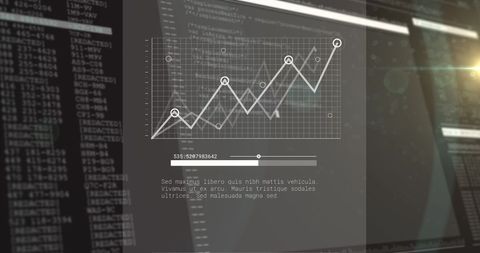
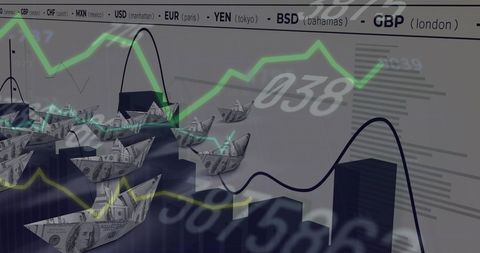
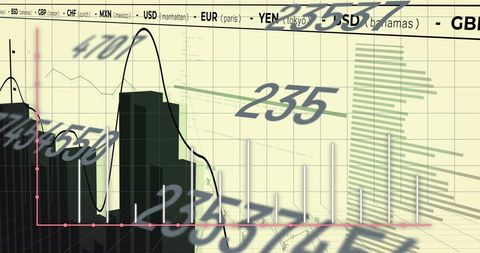
- Global Financial Data Processing Analysis on Digital Interface
Global Financial Data Processing Analysis on Digital Interface Image

This image depicts financial data processing screens with global currency information and fluctuating graphs on black background. Ideal for representing global business, digital finance, or data-driven analysis. Useful for financial presentations, business publications, or illustrating technological advancements in economics.

downloads
Tags:
More
Credit Photo
If you would like to credit the Photo, here are some ways you can do so
Text Link
photo Link
<span class="text-link">
<span>
<a target="_blank" href=https://pikwizard.com/photo/global-financial-data-processing-analysis-on-digital-interface/8ba38e218f5cceba24ea802632bc3d49/>PikWizard</a>
</span>
</span>
<span class="image-link">
<span
style="margin: 0 0 20px 0; display: inline-block; vertical-align: middle; width: 100%;"
>
<a
target="_blank"
href="https://pikwizard.com/photo/global-financial-data-processing-analysis-on-digital-interface/8ba38e218f5cceba24ea802632bc3d49/"
style="text-decoration: none; font-size: 10px; margin: 0;"
>
<img src="https://pikwizard.com/pw/medium/8ba38e218f5cceba24ea802632bc3d49.jpg" style="margin: 0; width: 100%;" alt="" />
<p style="font-size: 12px; margin: 0;">PikWizard</p>
</a>
</span>
</span>
Free (free of charge)
Free for personal and commercial use.
Author: Authentic Images