
- Home >
- Stock Photos >
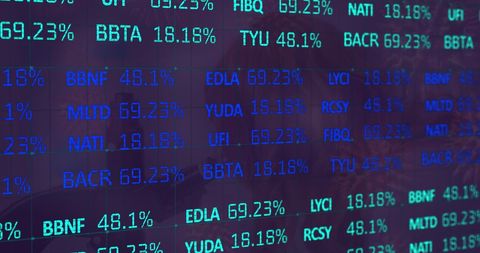
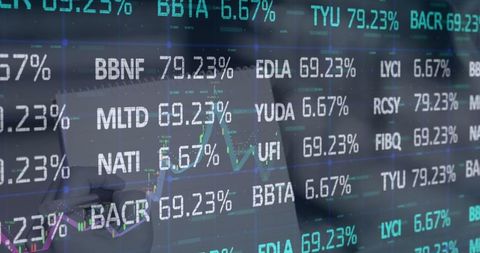
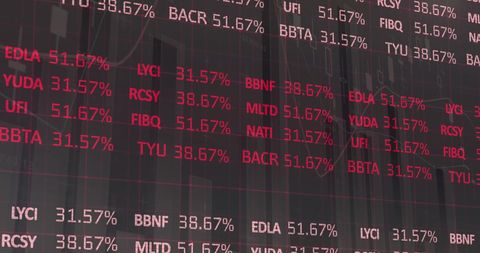
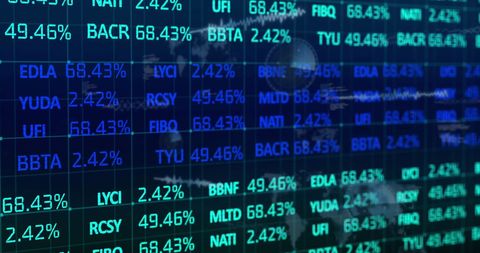
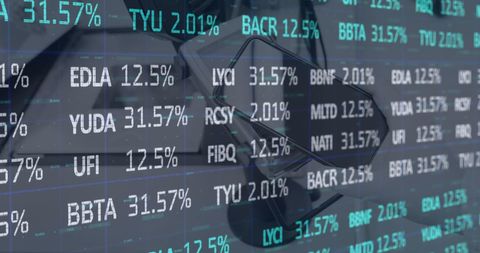
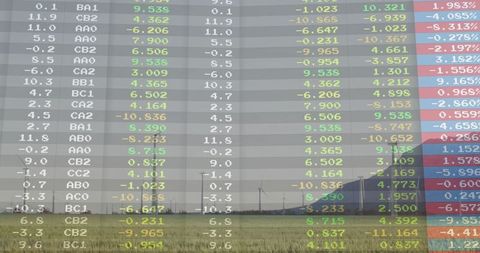
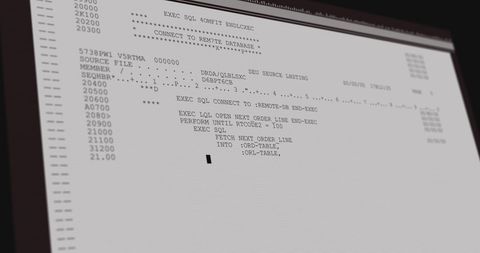
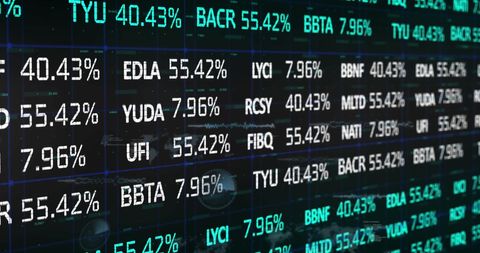
- Global Financial Data Processing and Stock Market Interface
Global Financial Data Processing and Stock Market Interface Image
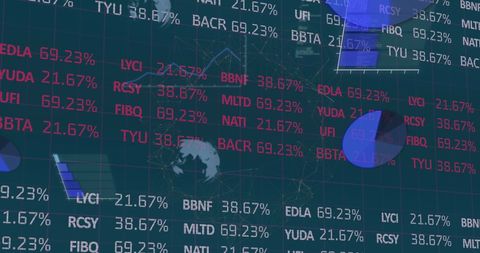
Display of stock market data and financial analytics represented on digital interfaces for potential investment assessment. Useful for materials on global finance, investment opportunities, financial technologies, and data-driven business strategy development.
Powered by 


downloads
Tags:
More
Credit Photo
If you would like to credit the Photo, here are some ways you can do so
Text Link
photo Link
<span class="text-link">
<span>
<a target="_blank" href=https://pikwizard.com/photo/global-financial-data-processing-and-stock-market-interface/5d3292ecd3cf6c2d0da2c65f62d6654b/>PikWizard</a>
</span>
</span>
<span class="image-link">
<span
style="margin: 0 0 20px 0; display: inline-block; vertical-align: middle; width: 100%;"
>
<a
target="_blank"
href="https://pikwizard.com/photo/global-financial-data-processing-and-stock-market-interface/5d3292ecd3cf6c2d0da2c65f62d6654b/"
style="text-decoration: none; font-size: 10px; margin: 0;"
>
<img src="https://pikwizard.com/pw/medium/5d3292ecd3cf6c2d0da2c65f62d6654b.jpg" style="margin: 0; width: 100%;" alt="" />
<p style="font-size: 12px; margin: 0;">PikWizard</p>
</a>
</span>
</span>
Free (free of charge)
Free for personal and commercial use.
Author: People Creations
Similar Free Stock Images

Premium

Premium


Premium


Premium


Premium


Premium


Premium


Premium

Premium


Premium


Premium

Premium


Premium


Premium

Premium


Premium

Premium


Premium


Premium


Premium


Premium


Premium


Premium


Premium


Premium


Explore More Free Stock Images