
- Home >
- Stock Photos >
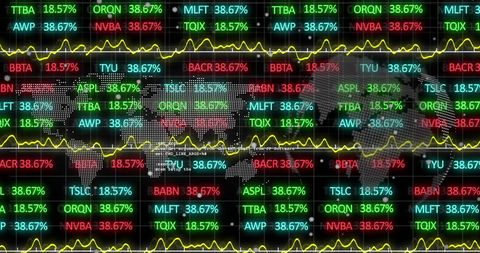
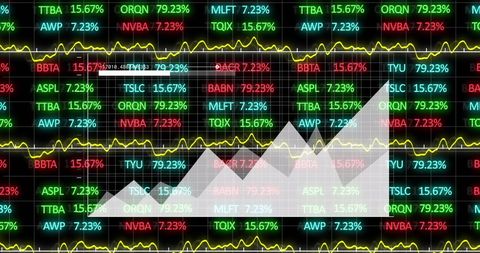
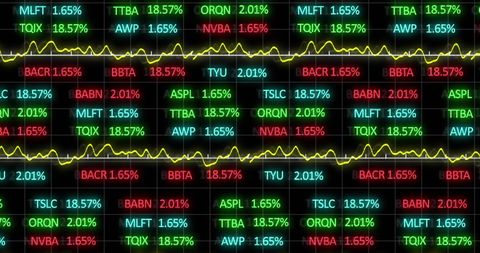
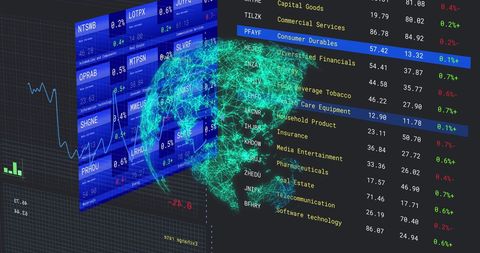
- Global Financial Data Processing on Digital Panels with Graphs
Global Financial Data Processing on Digital Panels with Graphs Image
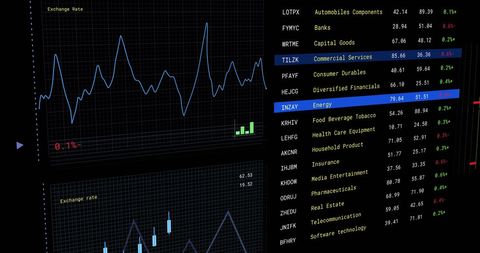
Displays a digital financial data interface featuring graphs, charts, and a global map. Utilized in presentations about global markets, business analysis, or financial tech advancements, highlighting connectivity and data analysis trends.
Powered by  - Get 15% off with code: PIKWIZARD15


downloads
Tags:
More
Credit Photo
If you would like to credit the Photo, here are some ways you can do so
Text Link
photo Link
<span class="text-link">
<span>
<a target="_blank" href=https://pikwizard.com/photo/global-financial-data-processing-on-digital-panels-with-graphs/625619d6aff6ff9eea860b806861e59c/>PikWizard</a>
</span>
</span>
<span class="image-link">
<span
style="margin: 0 0 20px 0; display: inline-block; vertical-align: middle; width: 100%;"
>
<a
target="_blank"
href="https://pikwizard.com/photo/global-financial-data-processing-on-digital-panels-with-graphs/625619d6aff6ff9eea860b806861e59c/"
style="text-decoration: none; font-size: 10px; margin: 0;"
>
<img src="https://pikwizard.com/pw/medium/625619d6aff6ff9eea860b806861e59c.jpg" style="margin: 0; width: 100%;" alt="" />
<p style="font-size: 12px; margin: 0;">PikWizard</p>
</a>
</span>
</span>
Free (free of charge)
Free for personal and commercial use.
Author: Authentic Images
Similar Free Stock Images

Premium


Premium

Premium


Premium


Premium

Premium
Premium


Premium

Premium

Premium

Premium


Premium


Premium

Premium


Premium


Premium

Premium


Premium


Premium


Premium


Premium


Premium


Premium


Premium


Premium


Explore More Free Stock Images