- Home >
- Stock Photos >
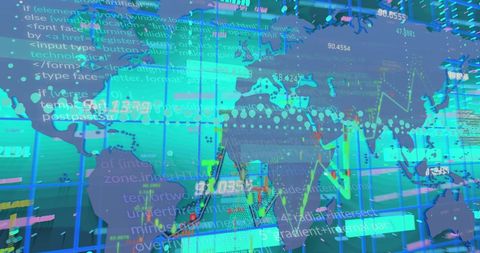
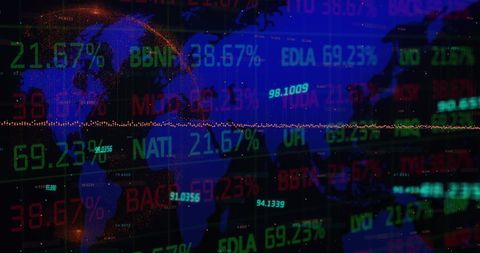
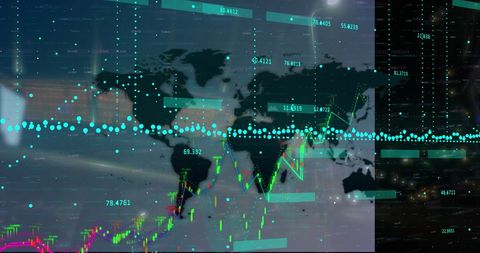
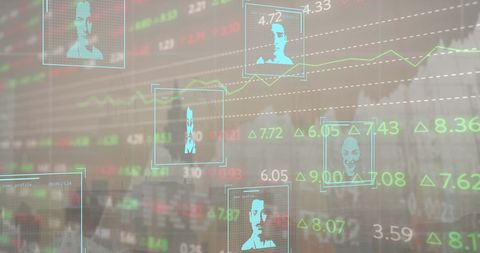
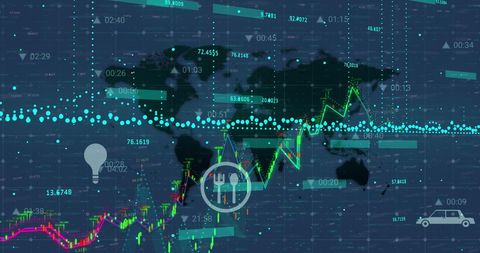
- Global Financial Data Processing Visualization on World Map
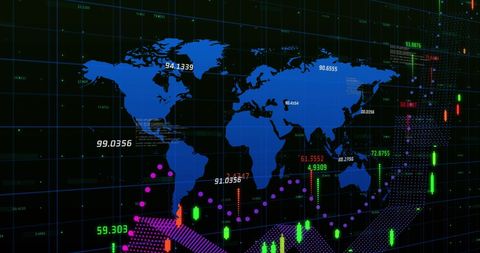
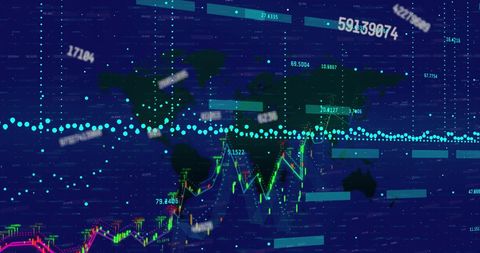
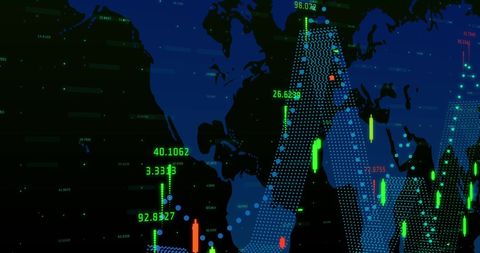
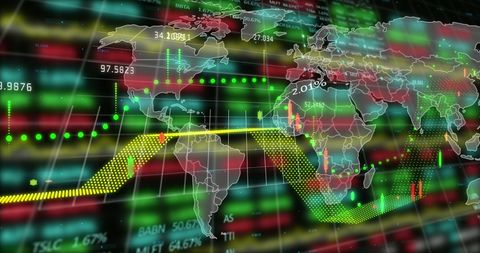
Global Financial Data Processing Visualization on World Map Image

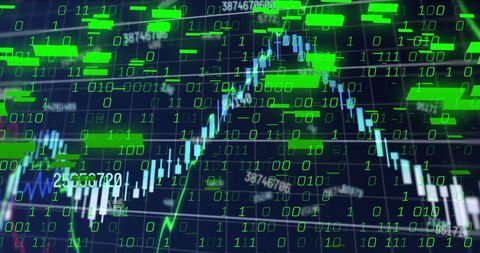
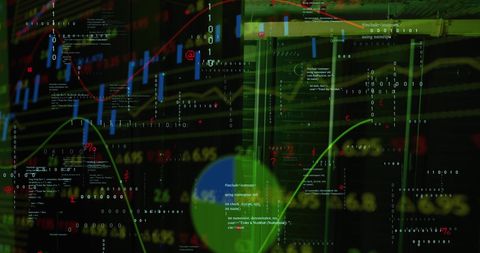
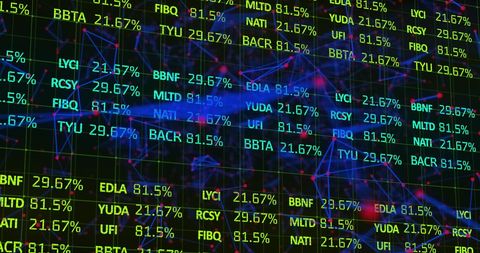
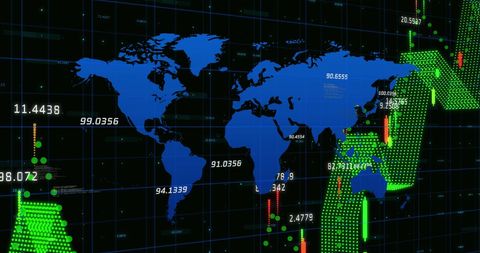
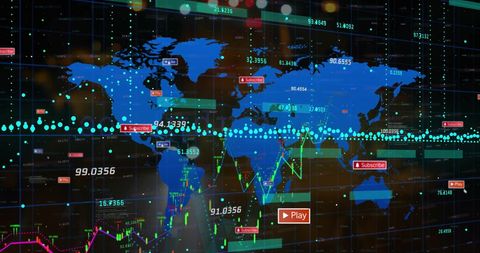
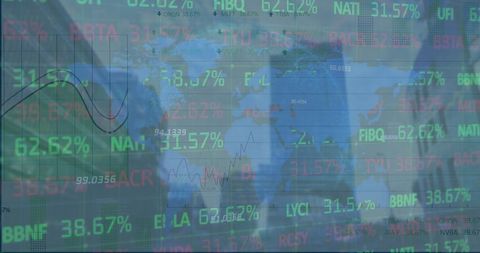
Digital rendering showcasing complex financial data and stock market trends overlaying a world map. Visual elements represent analytics and dynamic economic activity with bright neon colors. Ideal for illustrating concepts of global economics, fintech innovations, market trends, and financial news presentations. Useful in presentations, marketing strategies, and educational resources emphasizing financial and technical growth.

downloads
Tags:
More
Credit Photo
If you would like to credit the Photo, here are some ways you can do so
Text Link
photo Link
<span class="text-link">
<span>
<a target="_blank" href=https://pikwizard.com/photo/global-financial-data-processing-visualization-on-world-map/c00933c0145f465eb685e208211c47d9/>PikWizard</a>
</span>
</span>
<span class="image-link">
<span
style="margin: 0 0 20px 0; display: inline-block; vertical-align: middle; width: 100%;"
>
<a
target="_blank"
href="https://pikwizard.com/photo/global-financial-data-processing-visualization-on-world-map/c00933c0145f465eb685e208211c47d9/"
style="text-decoration: none; font-size: 10px; margin: 0;"
>
<img src="https://pikwizard.com/pw/medium/c00933c0145f465eb685e208211c47d9.jpg" style="margin: 0; width: 100%;" alt="" />
<p style="font-size: 12px; margin: 0;">PikWizard</p>
</a>
</span>
</span>
Free (free of charge)
Free for personal and commercial use.
Author: Creative Art