
- Home >
- Stock Photos >
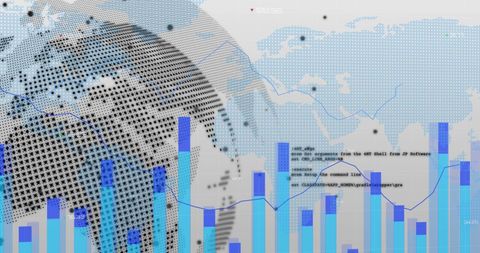
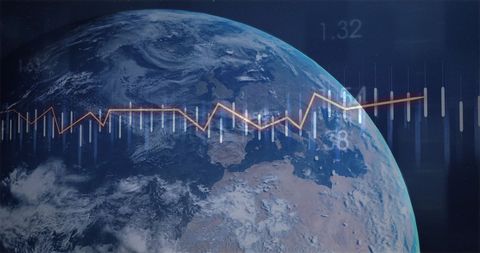
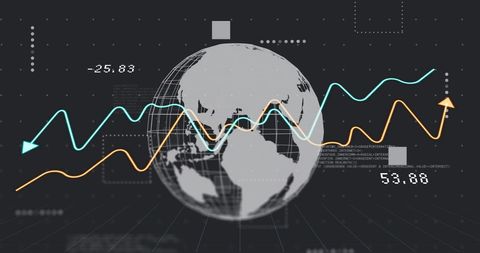
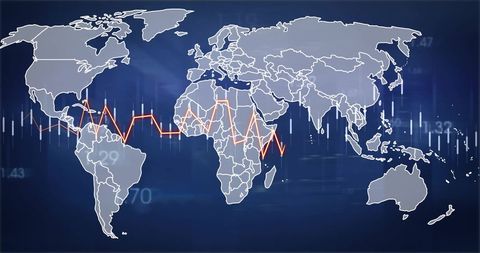
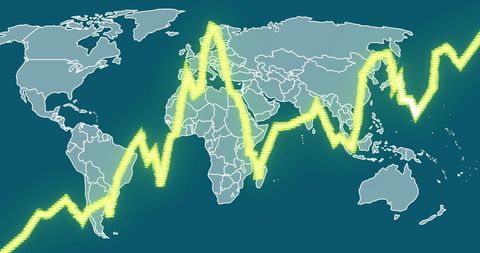
- Global Financial Data Processing with Abstract Globe
Global Financial Data Processing with Abstract Globe Image

Illustrates a dynamic representation of financial data processing over a digital globe. Ideal for use in presentations about global business, finance technology advancements, economic analysis, and international trade strategies. Useful for conveying the impact of global economic trends on markets.
Powered by 


downloads
Tags:
More
Credit Photo
If you would like to credit the Photo, here are some ways you can do so
Text Link
photo Link
<span class="text-link">
<span>
<a target="_blank" href=https://pikwizard.com/photo/global-financial-data-processing-with-abstract-globe/9d489e21c4f977f99bd7e8ec4a071ede/>PikWizard</a>
</span>
</span>
<span class="image-link">
<span
style="margin: 0 0 20px 0; display: inline-block; vertical-align: middle; width: 100%;"
>
<a
target="_blank"
href="https://pikwizard.com/photo/global-financial-data-processing-with-abstract-globe/9d489e21c4f977f99bd7e8ec4a071ede/"
style="text-decoration: none; font-size: 10px; margin: 0;"
>
<img src="https://pikwizard.com/pw/medium/9d489e21c4f977f99bd7e8ec4a071ede.jpg" style="margin: 0; width: 100%;" alt="" />
<p style="font-size: 12px; margin: 0;">PikWizard</p>
</a>
</span>
</span>
Free (free of charge)
Free for personal and commercial use.
Author: Awesome Content
Similar Free Stock Images

Premium


Premium


Premium


Premium

Premium


Premium


Premium


Premium


Premium


Premium


Premium


Premium

Premium


Premium


Premium


Premium

Premium

Premium


Premium


Premium


Premium


Premium


Premium


Premium


Premium


Explore More Free Stock Images