- Home >
- Stock Photos >
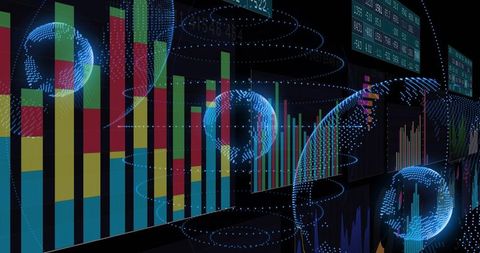
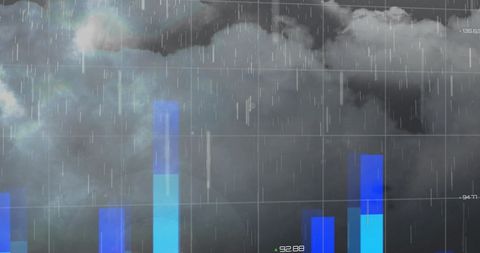
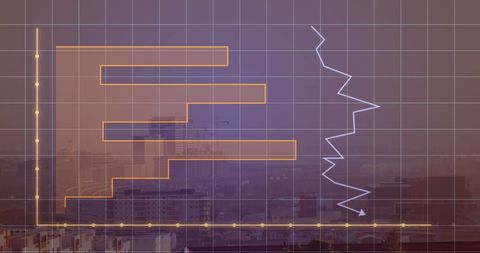
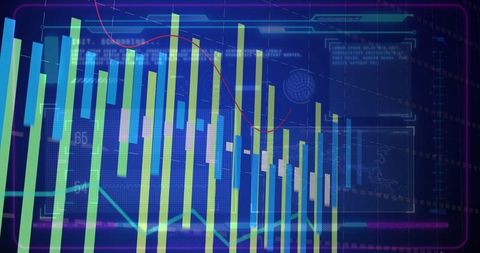
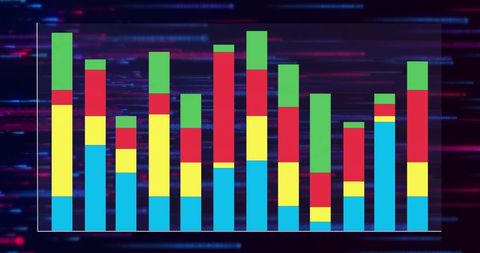
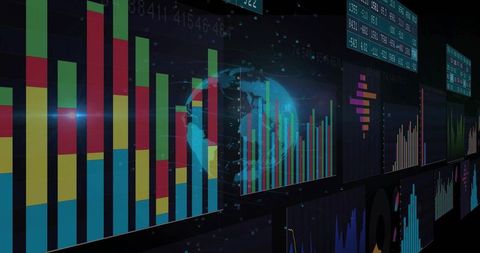
- Global Financial Data Processing with Bar Chart Visualization
Global Financial Data Processing with Bar Chart Visualization Image

Digital illustration depicting a vibrant bar chart in front of a globe, representing financial data and global business connections. Useful for presentations on finance and investments, illustrating data trends, or educating audiences about global market insights. Ideal for business blogs, websites focusing on technology and data science, and educational resources about financial analysis tools.

downloads
Tags:
More
Credit Photo
If you would like to credit the Photo, here are some ways you can do so
Text Link
photo Link
<span class="text-link">
<span>
<a target="_blank" href=https://pikwizard.com/photo/global-financial-data-processing-with-bar-chart-visualization/0068861d6c0bd2042cb6aaaefb8c8d0a/>PikWizard</a>
</span>
</span>
<span class="image-link">
<span
style="margin: 0 0 20px 0; display: inline-block; vertical-align: middle; width: 100%;"
>
<a
target="_blank"
href="https://pikwizard.com/photo/global-financial-data-processing-with-bar-chart-visualization/0068861d6c0bd2042cb6aaaefb8c8d0a/"
style="text-decoration: none; font-size: 10px; margin: 0;"
>
<img src="https://pikwizard.com/pw/medium/0068861d6c0bd2042cb6aaaefb8c8d0a.jpg" style="margin: 0; width: 100%;" alt="" />
<p style="font-size: 12px; margin: 0;">PikWizard</p>
</a>
</span>
</span>
Free (free of charge)
Free for personal and commercial use.
Author: Awesome Content