
- Home >
- Stock Photos >
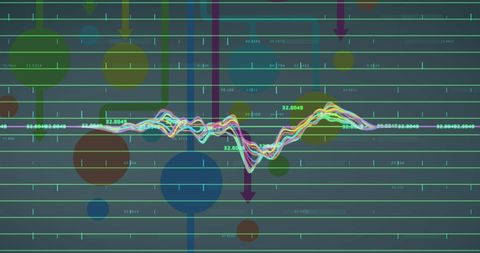
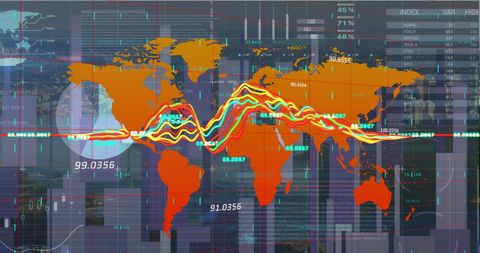
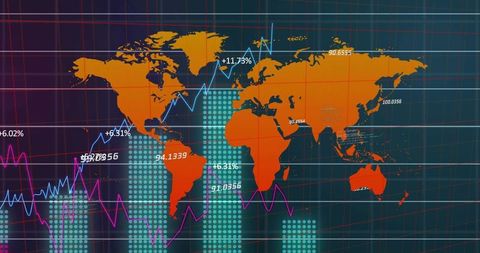
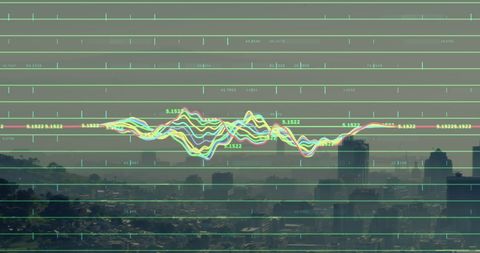
- Global Financial Data Processing with Graphs and Charts Overlay
Global Financial Data Processing with Graphs and Charts Overlay Image

Illustration of global financial data processing with overlay of colorful graphs and charts against a blue grid. Ideal for use in presentations about financial markets, technology blogs, and data analytics reports.
Powered by 


downloads
Tags:
More
Credit Photo
If you would like to credit the Photo, here are some ways you can do so
Text Link
photo Link
<span class="text-link">
<span>
<a target="_blank" href=https://pikwizard.com/photo/global-financial-data-processing-with-graphs-and-charts-overlay/eca88751d64e76881edab90dabd96bda/>PikWizard</a>
</span>
</span>
<span class="image-link">
<span
style="margin: 0 0 20px 0; display: inline-block; vertical-align: middle; width: 100%;"
>
<a
target="_blank"
href="https://pikwizard.com/photo/global-financial-data-processing-with-graphs-and-charts-overlay/eca88751d64e76881edab90dabd96bda/"
style="text-decoration: none; font-size: 10px; margin: 0;"
>
<img src="https://pikwizard.com/pw/medium/eca88751d64e76881edab90dabd96bda.jpg" style="margin: 0; width: 100%;" alt="" />
<p style="font-size: 12px; margin: 0;">PikWizard</p>
</a>
</span>
</span>
Free (free of charge)
Free for personal and commercial use.
Author: Awesome Content
Similar Free Stock Images

Premium


Premium


Premium


Premium


Premium


Premium


Premium

Premium


Premium


Premium


Premium


Premium


Premium


Premium


Premium


Premium


Premium


Premium


Premium

Premium


Premium


Premium


Premium


Premium


Premium


Explore More Free Stock Images