- Home >
- Stock Photos >
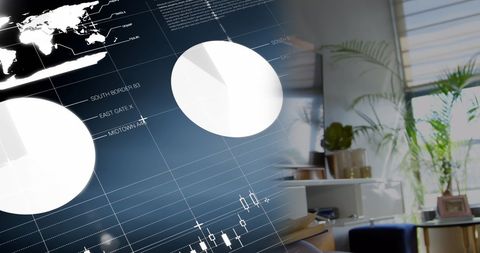
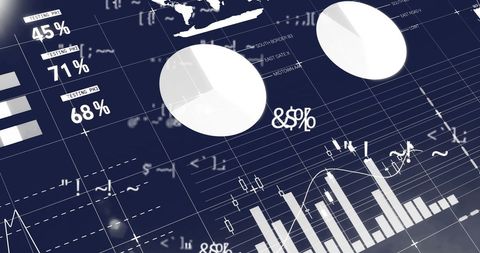
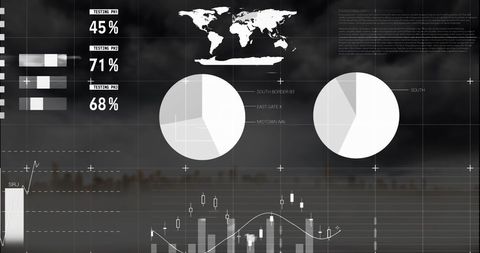
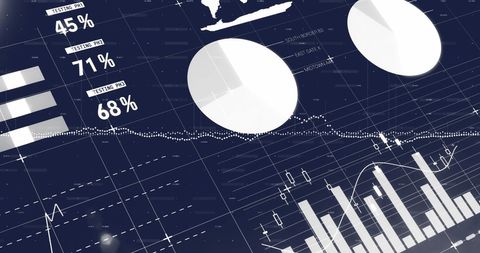
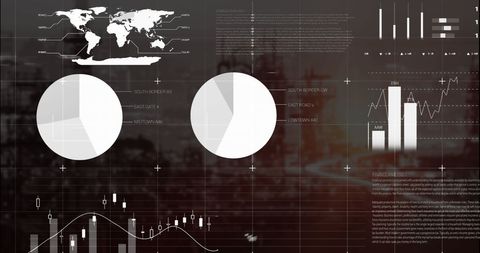
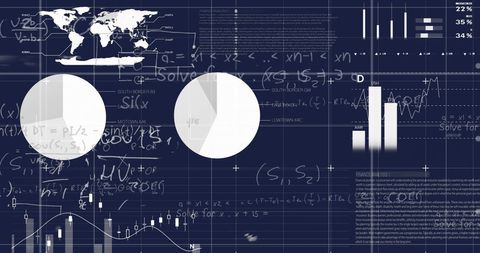
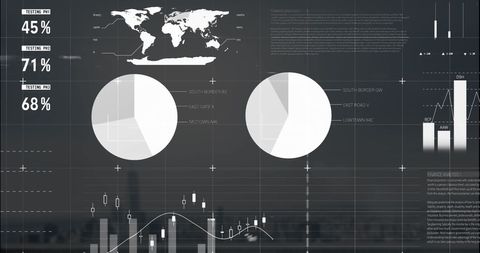
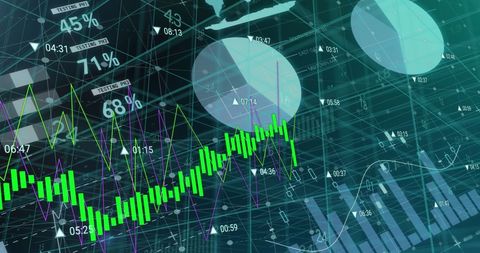
- Global Financial Data Processing with Graphs and Charts
Global Financial Data Processing with Graphs and Charts Image

Abstract representation of financial data processing using charts and graphs on a dark background. Highlighting aspects of global finance and connectivity, showcasing data analysis. Perfect for illustrating finance topics, stock market trends, and overall business analytics.

downloads
Tags:
More
Credit Photo
If you would like to credit the Photo, here are some ways you can do so
Text Link
photo Link
<span class="text-link">
<span>
<a target="_blank" href=https://pikwizard.com/photo/global-financial-data-processing-with-graphs-and-charts/5ab8a36020f0ffd89bc87f26dcd4b5b6/>PikWizard</a>
</span>
</span>
<span class="image-link">
<span
style="margin: 0 0 20px 0; display: inline-block; vertical-align: middle; width: 100%;"
>
<a
target="_blank"
href="https://pikwizard.com/photo/global-financial-data-processing-with-graphs-and-charts/5ab8a36020f0ffd89bc87f26dcd4b5b6/"
style="text-decoration: none; font-size: 10px; margin: 0;"
>
<img src="https://pikwizard.com/pw/medium/5ab8a36020f0ffd89bc87f26dcd4b5b6.jpg" style="margin: 0; width: 100%;" alt="" />
<p style="font-size: 12px; margin: 0;">PikWizard</p>
</a>
</span>
</span>
Free (free of charge)
Free for personal and commercial use.
Author: Authentic Images