- Home >
- Stock Photos >
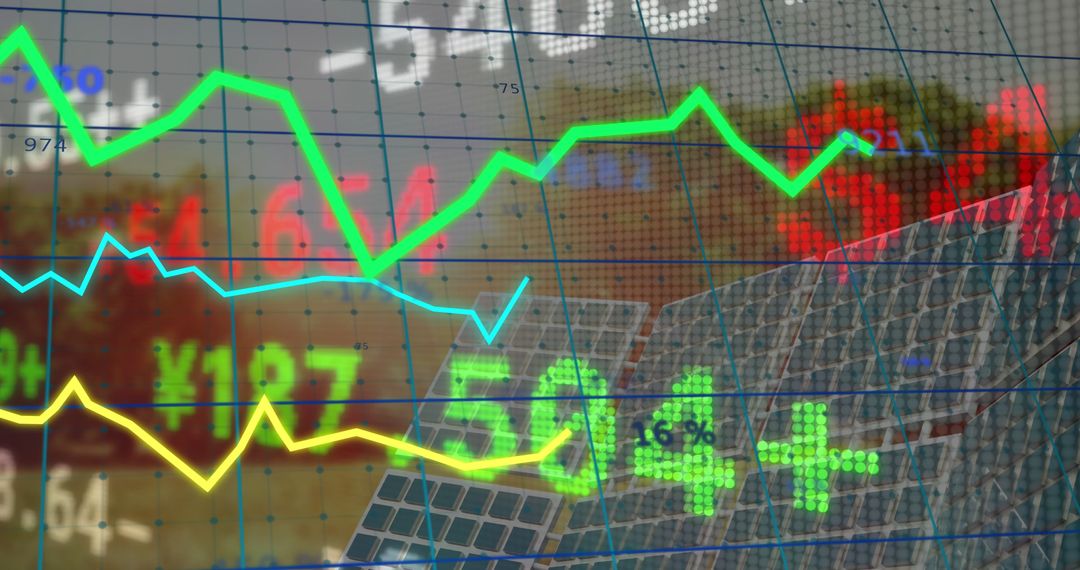
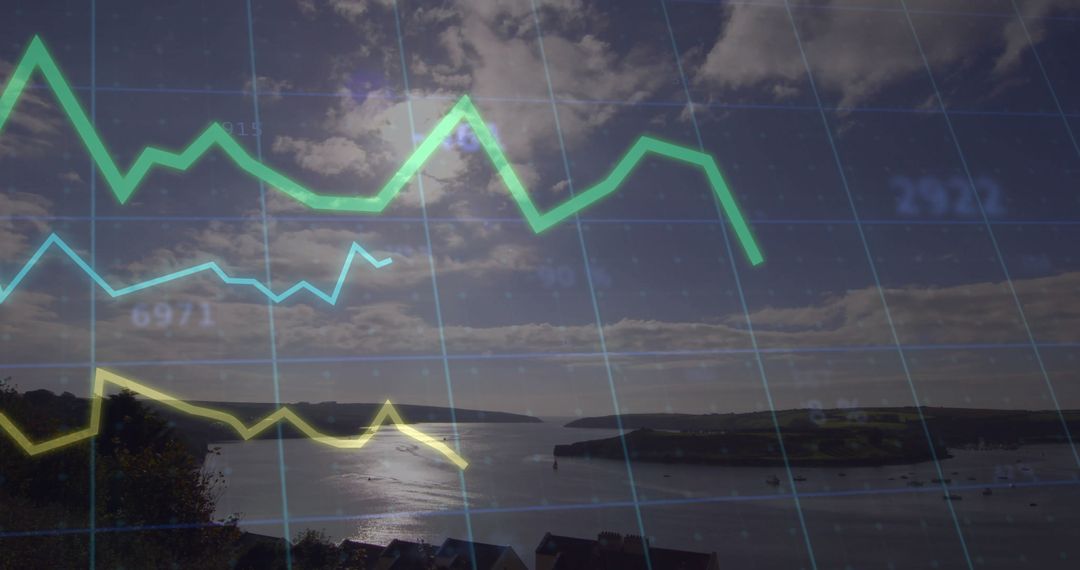
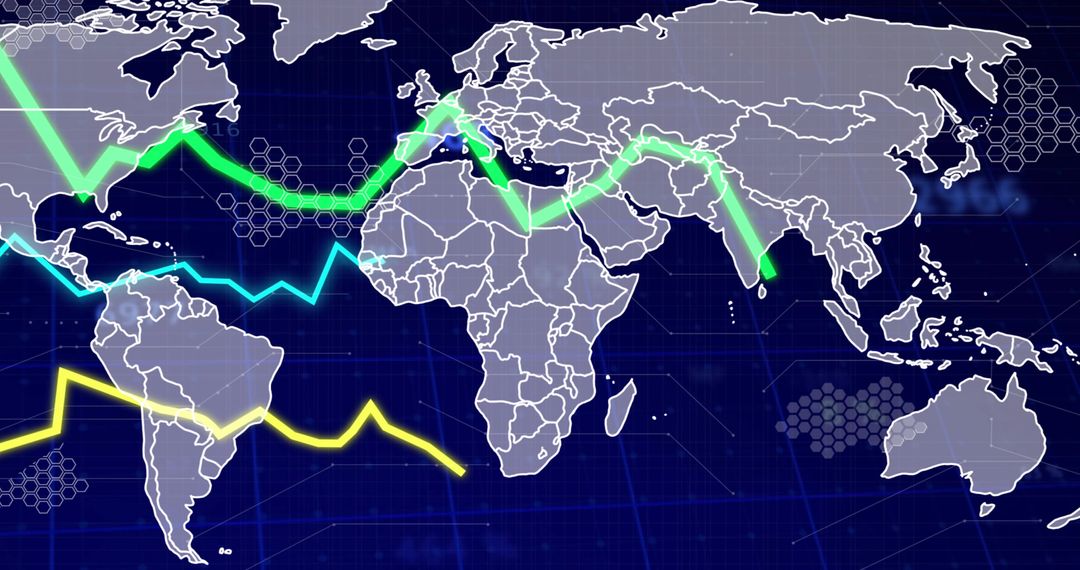
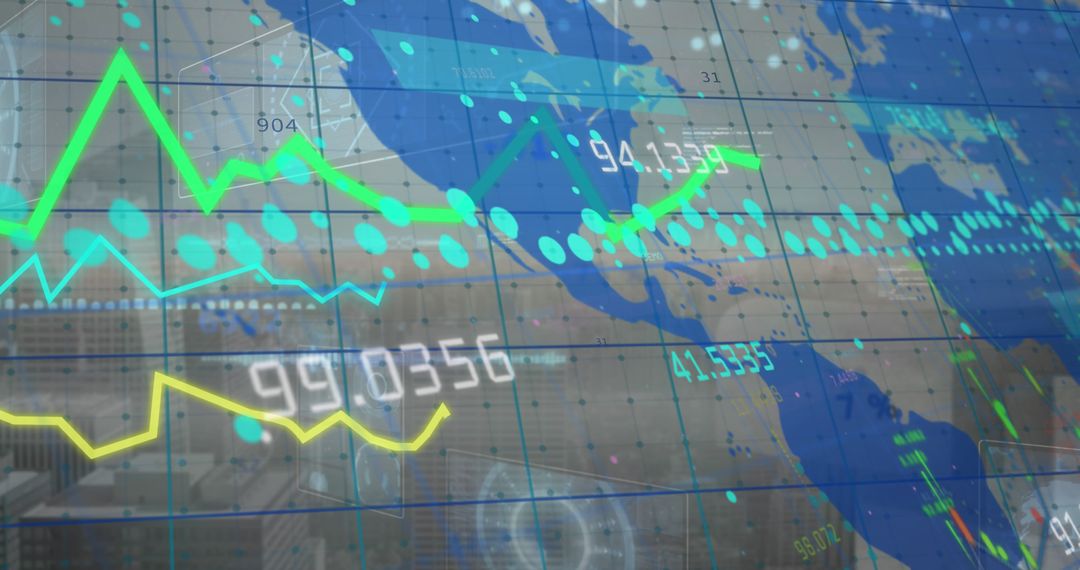
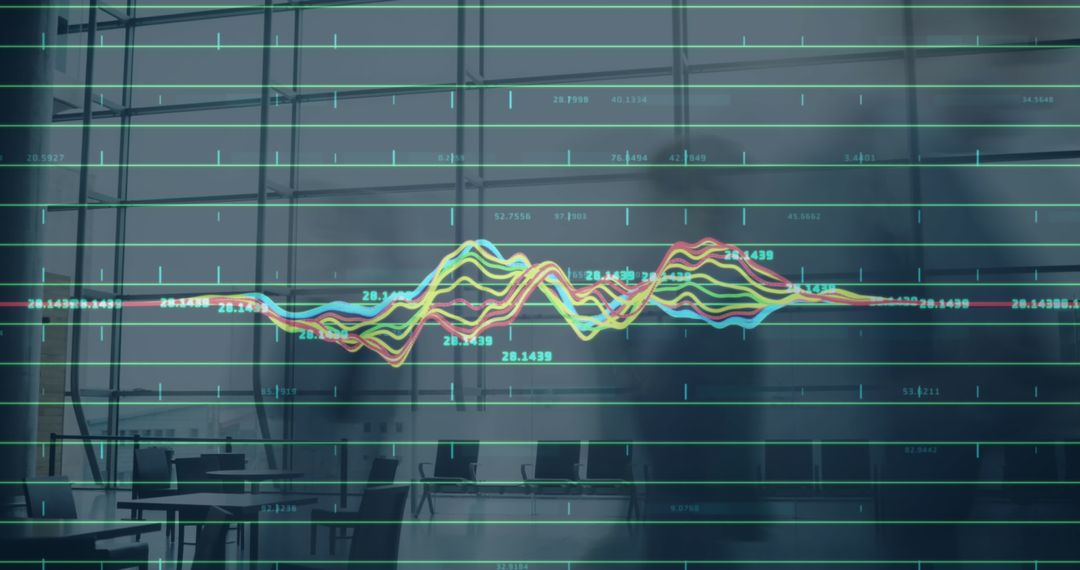
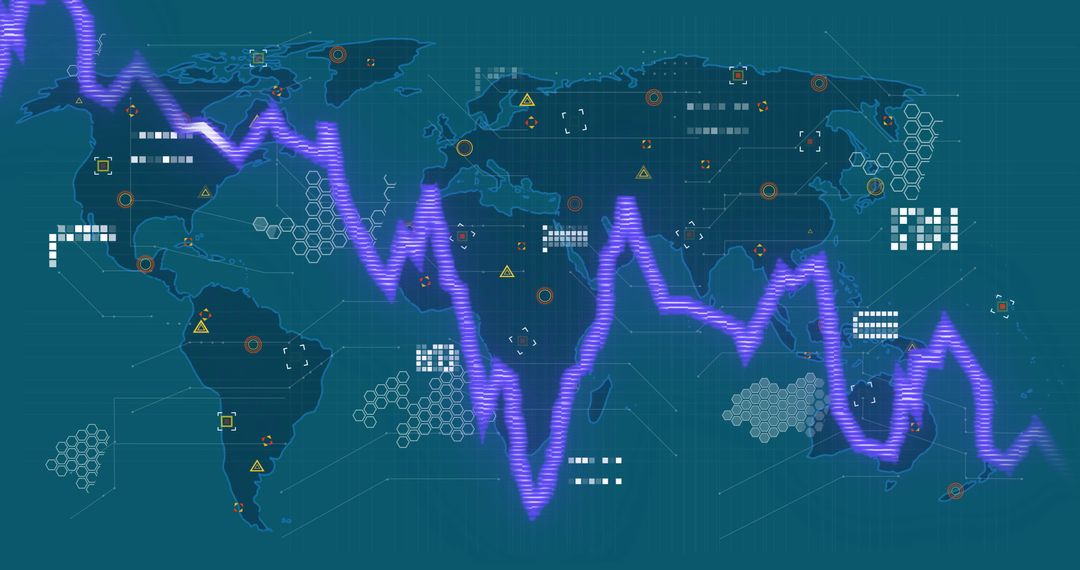
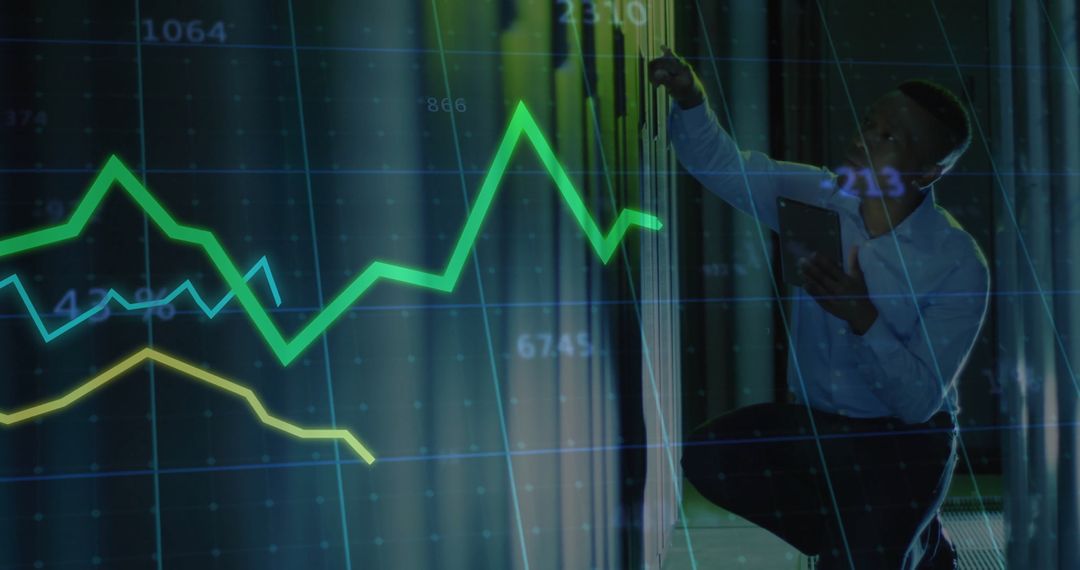
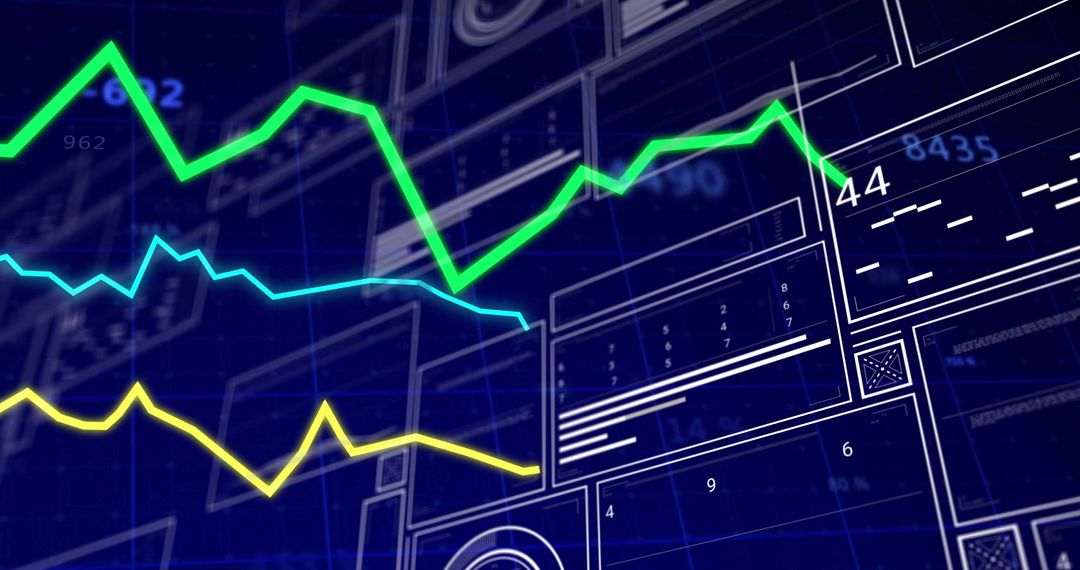
- Global Financial Data Trading Analytics Over Flames Concept
Global Financial Data Trading Analytics Over Flames Concept Image

Rendering of financial graphs and data points superimposed against an intense flame backdrop highlighting the volatility and dynamic nature of global finance. Useful for projects related to stock market volatility, economic disruptions, trading platforms, or digital financial transformations.
Powered by  - Get 15% off with code: PIKWIZARD15


2
downloads
downloads
Tags:
More
Credit Photo
If you would like to credit the Photo, here are some ways you can do so
Text Link
photo Link
<span class="text-link">
<span>
<a target="_blank" href=https://pikwizard.com/photo/global-financial-data-trading-analytics-over-flames-concept/ae0ed92fcdef0b1fcf7758ab0ad8818d/>PikWizard</a>
</span>
</span>
<span class="image-link">
<span
style="margin: 0 0 20px 0; display: inline-block; vertical-align: middle; width: 100%;"
>
<a
target="_blank"
href="https://pikwizard.com/photo/global-financial-data-trading-analytics-over-flames-concept/ae0ed92fcdef0b1fcf7758ab0ad8818d/"
style="text-decoration: none; font-size: 10px; margin: 0;"
>
<img src="https://pikwizard.com/pw/medium/ae0ed92fcdef0b1fcf7758ab0ad8818d.jpg" style="margin: 0; width: 100%;" alt="" />
<p style="font-size: 12px; margin: 0;">PikWizard</p>
</a>
</span>
</span>
Free (free of charge)
Free for personal and commercial use.
Author: People Creations
Similar Free Stock Images

Premium


Premium


Premium


Premium


Premium


Premium


Premium


Premium


Premium


Premium


Premium


Premium


Premium


Premium


Premium


Premium


Premium


Premium


Premium


Premium


Premium


Premium


Premium


Premium