
- Home >
- Stock Photos >
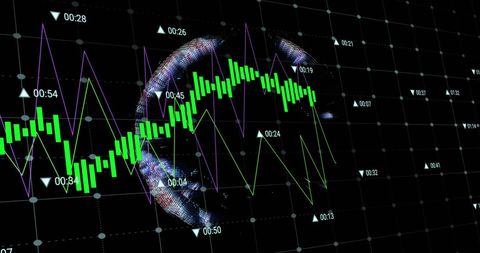
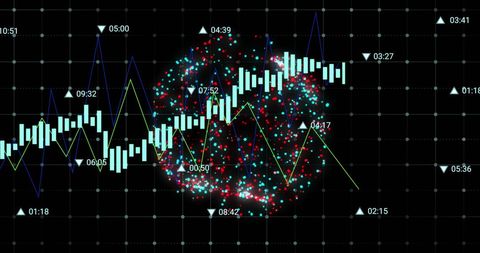
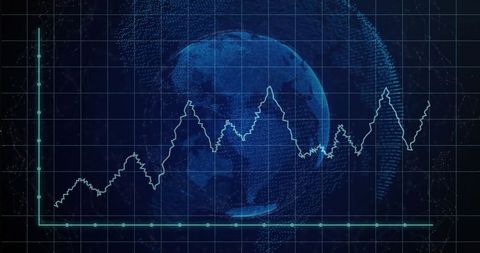
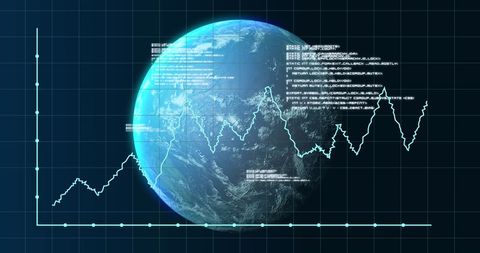
- Global Financial Data Trends on Digital World Map
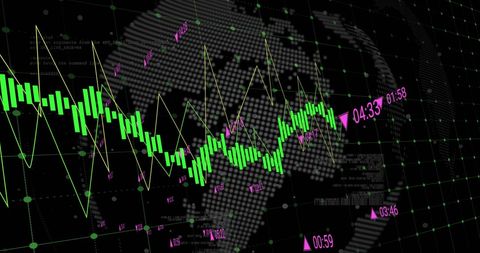
Global Financial Data Trends on Digital World Map Image
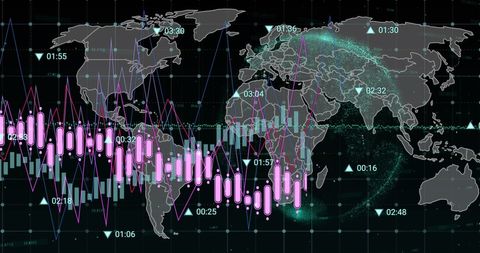
Illustrates complex financial data with graphs overlaid onto a map of the world, highlighting global economic ideas and financial markets. Ideal for presentations focusing on worldwide investment strategies, economic forecasting, or digital data analysis. Perfect for financial services advertising, educational materials, or reports on trader behavior in an interconnected world economy.
Powered by 


downloads
Tags:
More
Credit Photo
If you would like to credit the Photo, here are some ways you can do so
Text Link
photo Link
<span class="text-link">
<span>
<a target="_blank" href=https://pikwizard.com/photo/global-financial-data-trends-on-digital-world-map/3c19ce3cecf23aef7bd2d9f06e49772a/>PikWizard</a>
</span>
</span>
<span class="image-link">
<span
style="margin: 0 0 20px 0; display: inline-block; vertical-align: middle; width: 100%;"
>
<a
target="_blank"
href="https://pikwizard.com/photo/global-financial-data-trends-on-digital-world-map/3c19ce3cecf23aef7bd2d9f06e49772a/"
style="text-decoration: none; font-size: 10px; margin: 0;"
>
<img src="https://pikwizard.com/pw/medium/3c19ce3cecf23aef7bd2d9f06e49772a.jpg" style="margin: 0; width: 100%;" alt="" />
<p style="font-size: 12px; margin: 0;">PikWizard</p>
</a>
</span>
</span>
Free (free of charge)
Free for personal and commercial use.
Author: Authentic Images
Similar Free Stock Images

Premium


Premium


Premium

Premium


Premium


Premium


Premium


Premium


Premium


Premium


Premium


Premium


Premium


Premium


Premium


Premium


Premium


Premium


Premium


Premium


Premium


Premium


Premium


Premium


Premium

Explore More Free Stock Images