- Home >
- Stock Photos >
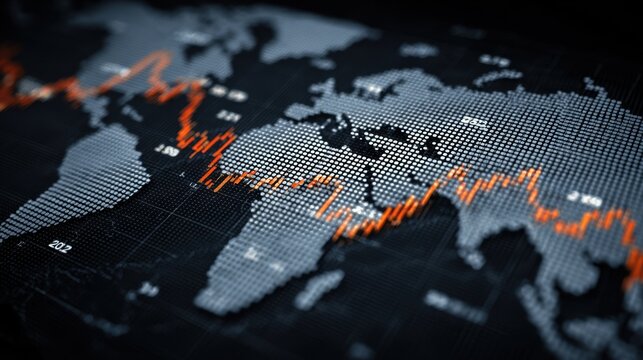
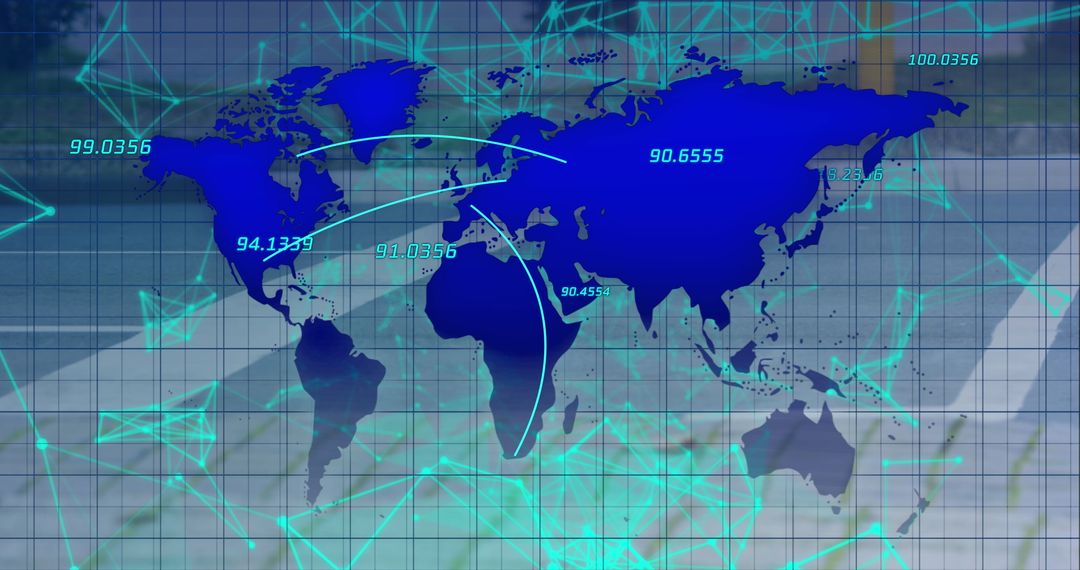
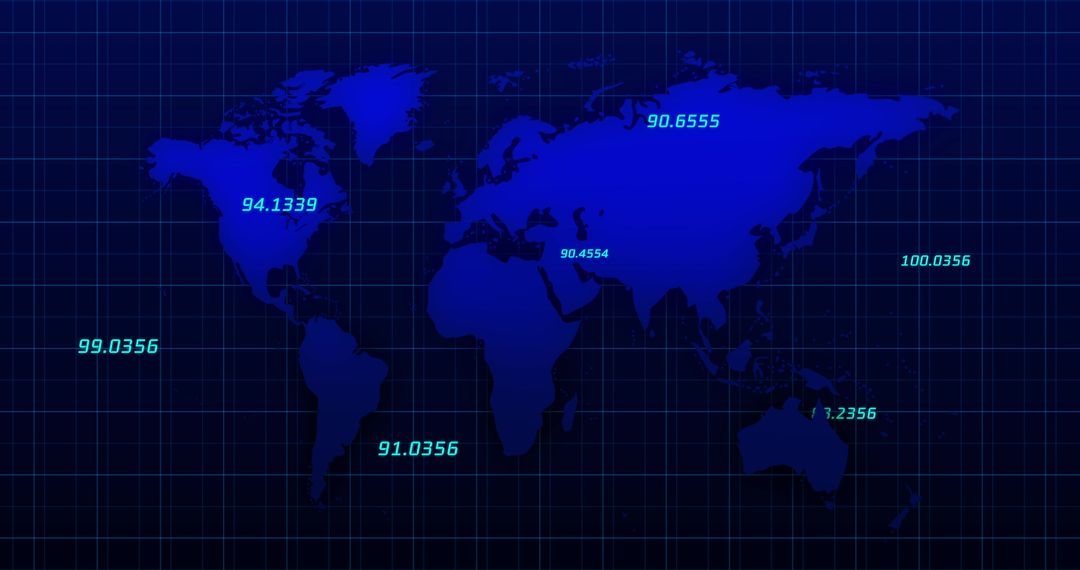
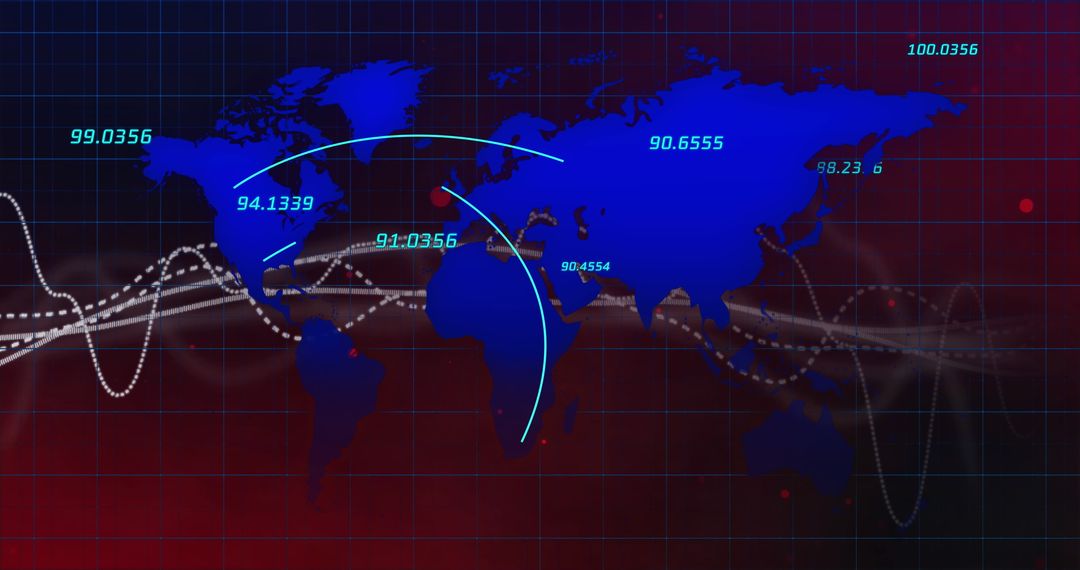
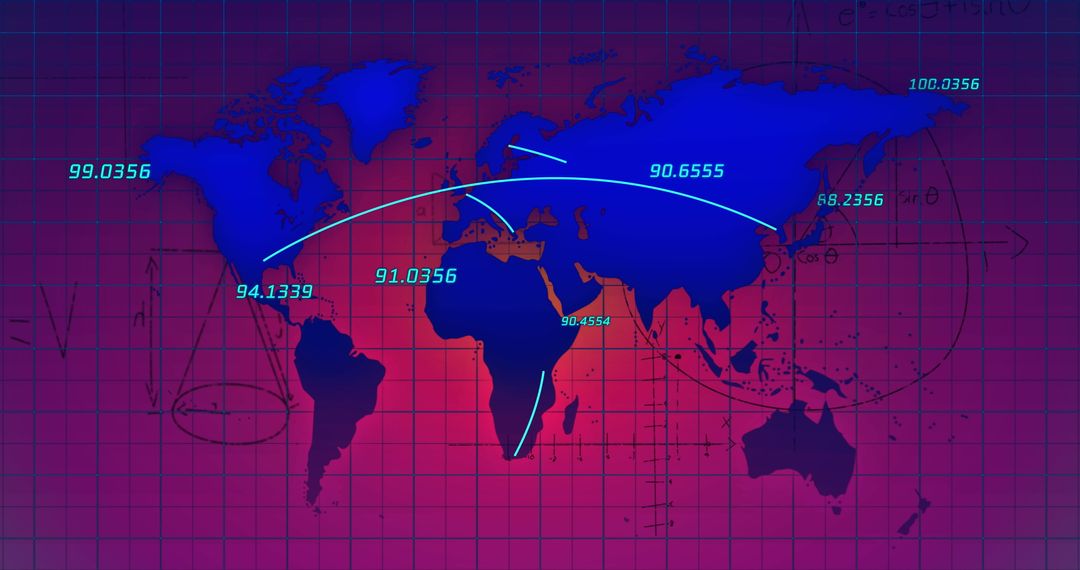
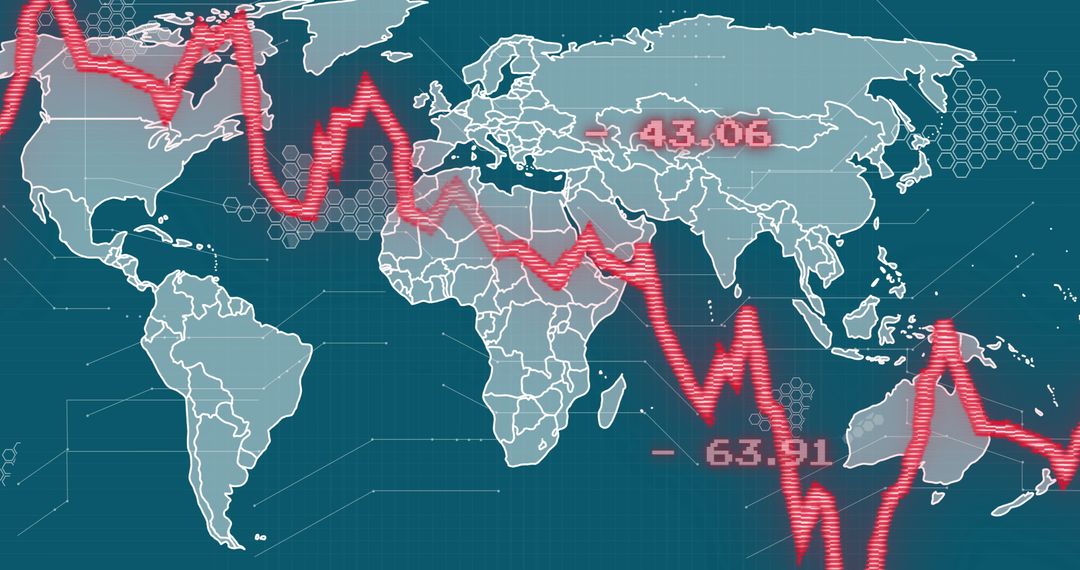
- Global Financial Data Trends on World Map
Global Financial Data Trends on World Map Image

Rising or fluctuating financial lines displayed on world map evokes concepts of global economy and digital finance. Ideal for illustrating international economic trends, business analytics presentations, or the dynamics of global markets. Useful for businesses or educators focusing on global trade or financial forecasting.
Powered by 


2
downloads
downloads
Tags:
More
Credit Photo
If you would like to credit the Photo, here are some ways you can do so
Text Link
photo Link
<span class="text-link">
<span>
<a target="_blank" href=https://pikwizard.com/photo/global-financial-data-trends-on-world-map/619c94d18e72bb197b25d6ecf66ee9d3/>PikWizard</a>
</span>
</span>
<span class="image-link">
<span
style="margin: 0 0 20px 0; display: inline-block; vertical-align: middle; width: 100%;"
>
<a
target="_blank"
href="https://pikwizard.com/photo/global-financial-data-trends-on-world-map/619c94d18e72bb197b25d6ecf66ee9d3/"
style="text-decoration: none; font-size: 10px; margin: 0;"
>
<img src="https://pikwizard.com/pw/medium/619c94d18e72bb197b25d6ecf66ee9d3.jpg" style="margin: 0; width: 100%;" alt="" />
<p style="font-size: 12px; margin: 0;">PikWizard</p>
</a>
</span>
</span>
Free (free of charge)
Free for personal and commercial use.
Author: People Creations
Similar Free Stock Images

Premium


Premium


Premium


Premium


Premium


Premium


Premium


Premium


Premium


Premium


Premium


Premium


Premium


Premium


Premium


Premium


Premium


Premium


Premium


Premium


Premium


Premium


Premium


Premium