
- Home >
- Stock Photos >
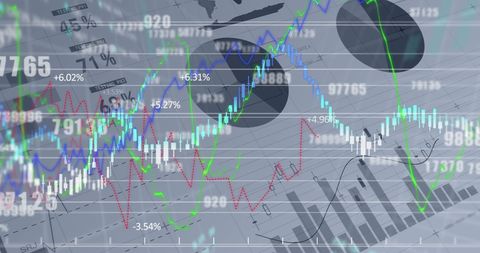
- Global Financial Data Visualization and Analysis
Global Financial Data Visualization and Analysis Image

This image presents a digital interface rich with financial data, showcasing various statistics and stock market trends with overlaid line charts and numerical percentages. It is ideal for illustrating concepts in global business, economic studies, financial analysis reports, and digital finance tool interfaces. Suitable for use in business presentations, investment websites, and educational materials about market trends and data analytics.
Powered by 


downloads
Tags:
More
Credit Photo
If you would like to credit the Photo, here are some ways you can do so
Text Link
photo Link
<span class="text-link">
<span>
<a target="_blank" href=https://pikwizard.com/photo/global-financial-data-visualization-and-analysis/1f97e695e0fb7b2f25145b187e2f26a9/>PikWizard</a>
</span>
</span>
<span class="image-link">
<span
style="margin: 0 0 20px 0; display: inline-block; vertical-align: middle; width: 100%;"
>
<a
target="_blank"
href="https://pikwizard.com/photo/global-financial-data-visualization-and-analysis/1f97e695e0fb7b2f25145b187e2f26a9/"
style="text-decoration: none; font-size: 10px; margin: 0;"
>
<img src="https://pikwizard.com/pw/medium/1f97e695e0fb7b2f25145b187e2f26a9.jpg" style="margin: 0; width: 100%;" alt="" />
<p style="font-size: 12px; margin: 0;">PikWizard</p>
</a>
</span>
</span>
Free (free of charge)
Free for personal and commercial use.
Author: Authentic Images
Similar Free Stock Images

Premium


Premium


Premium

Premium

Premium


Premium


Premium


Premium

Premium


Premium


Premium


Premium


Premium


Premium


Premium

Premium

Premium


Premium


Premium


Premium


Premium


Premium


Premium


Premium

Premium


Explore More Free Stock Images