- Home >
- Stock Photos >
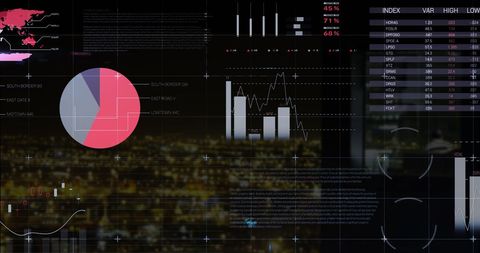
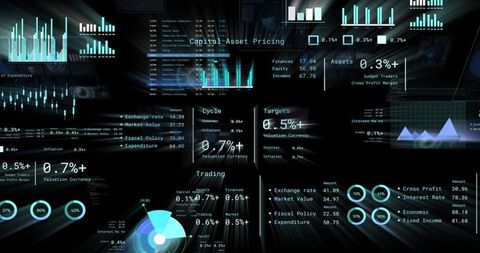
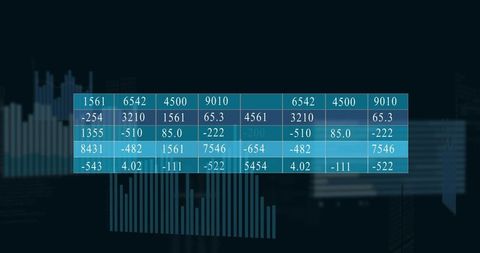
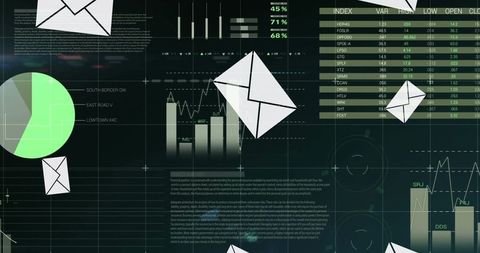
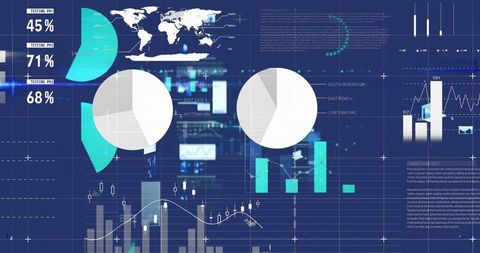
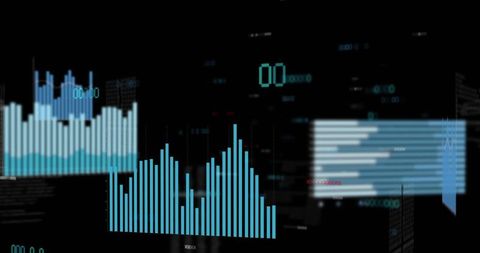
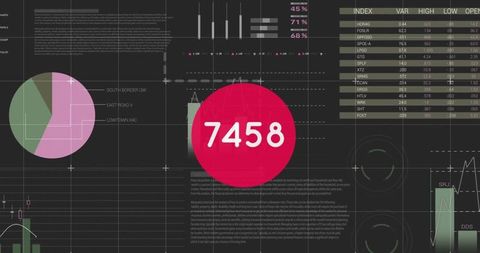
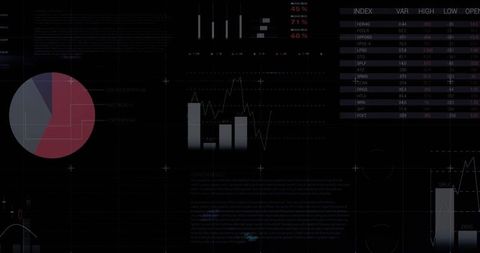
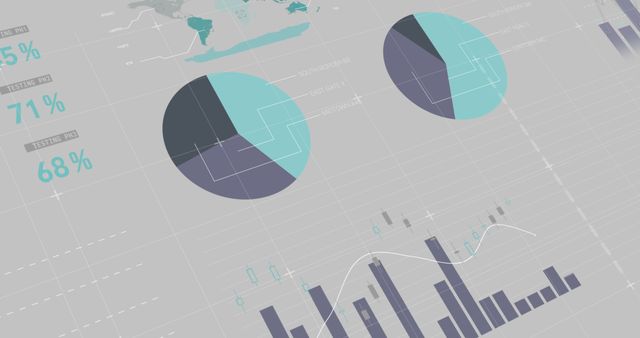
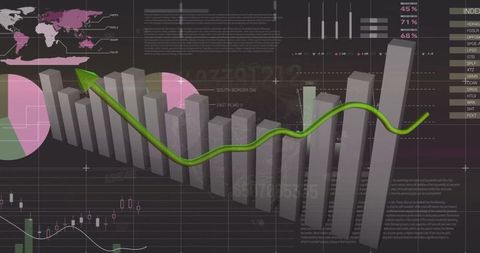
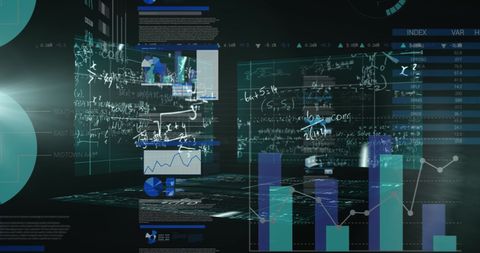
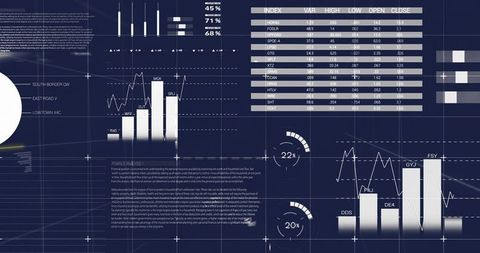
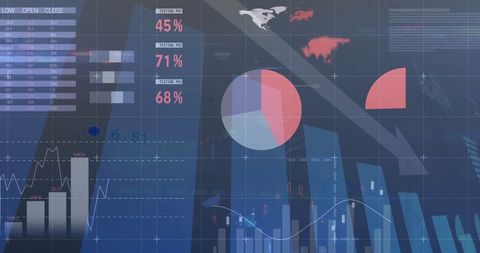
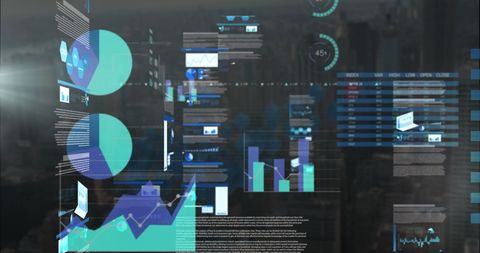
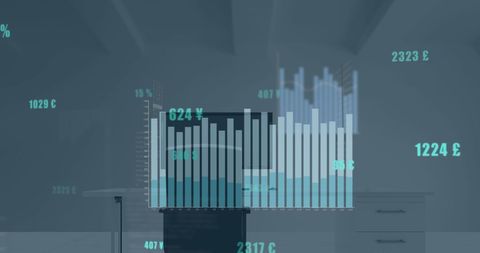
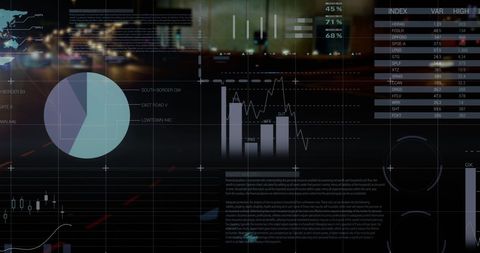
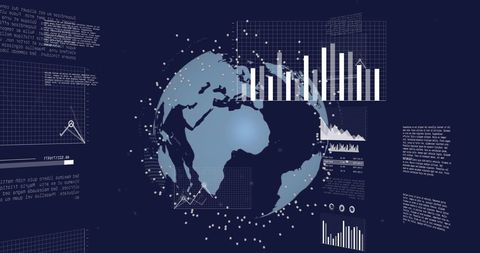
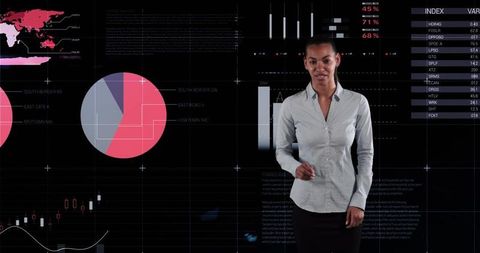
- Global Financial Data Visualization Background
Global Financial Data Visualization Background Image
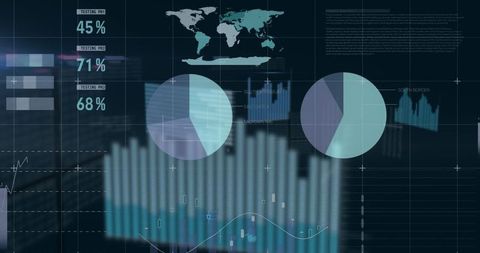
Variety of financial and data visualization surfacing through multiple charts and graphs on black background, indicating concepts in global finance and economic analysis. Elements like world map can be used to illustrate macroeconomic discussions while bar and pie charts are perfect for financial reports or presentations. Suitable for digital finance platforms, investing apps, or economic studies aiding visual story-telling in tech-driven environments.

downloads
Tags:
More
Credit Photo
If you would like to credit the Photo, here are some ways you can do so
Text Link
photo Link
<span class="text-link">
<span>
<a target="_blank" href=https://pikwizard.com/photo/global-financial-data-visualization-background/9661088fd80f69f8826e5b6b192d1e8f/>PikWizard</a>
</span>
</span>
<span class="image-link">
<span
style="margin: 0 0 20px 0; display: inline-block; vertical-align: middle; width: 100%;"
>
<a
target="_blank"
href="https://pikwizard.com/photo/global-financial-data-visualization-background/9661088fd80f69f8826e5b6b192d1e8f/"
style="text-decoration: none; font-size: 10px; margin: 0;"
>
<img src="https://pikwizard.com/pw/medium/9661088fd80f69f8826e5b6b192d1e8f.jpg" style="margin: 0; width: 100%;" alt="" />
<p style="font-size: 12px; margin: 0;">PikWizard</p>
</a>
</span>
</span>
Free (free of charge)
Free for personal and commercial use.
Author: Authentic Images