- Home >
- Stock Photos >
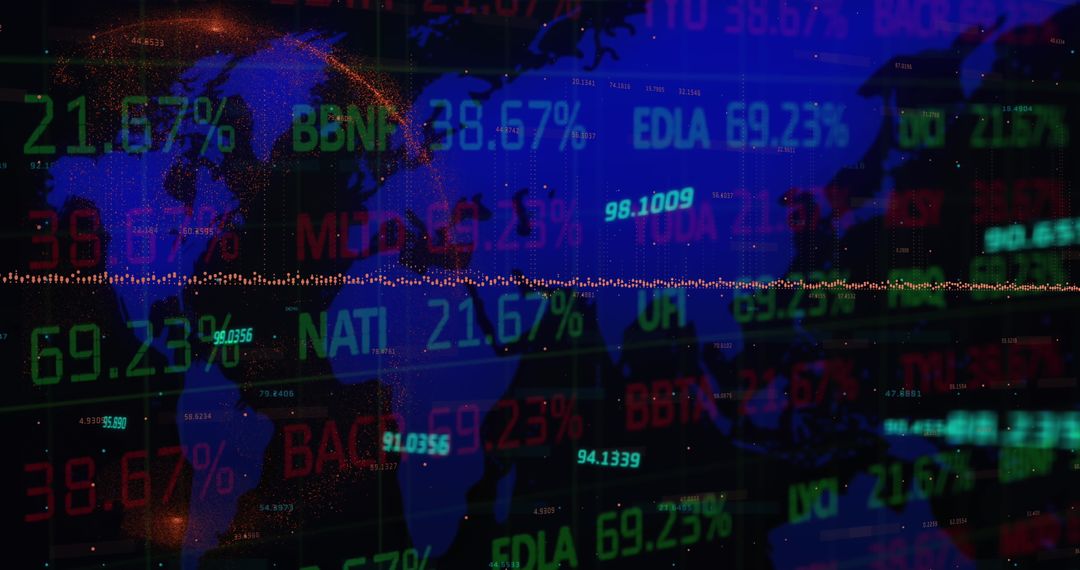
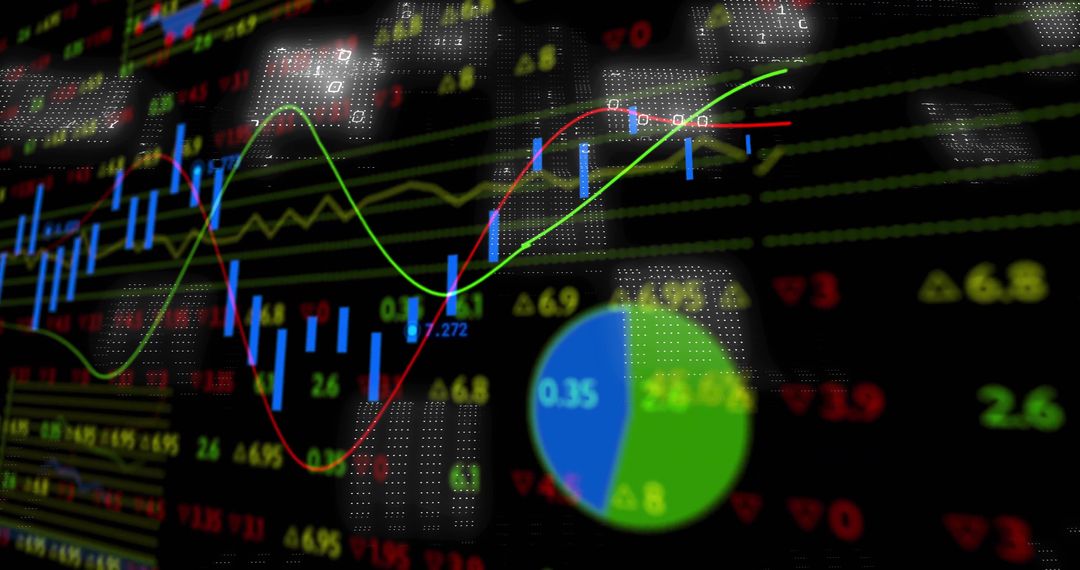
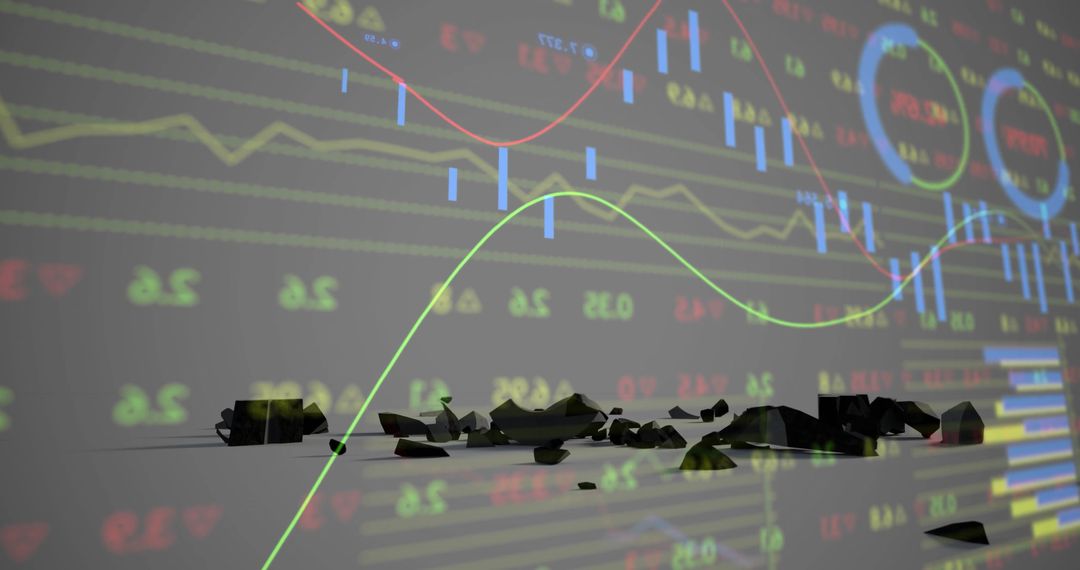
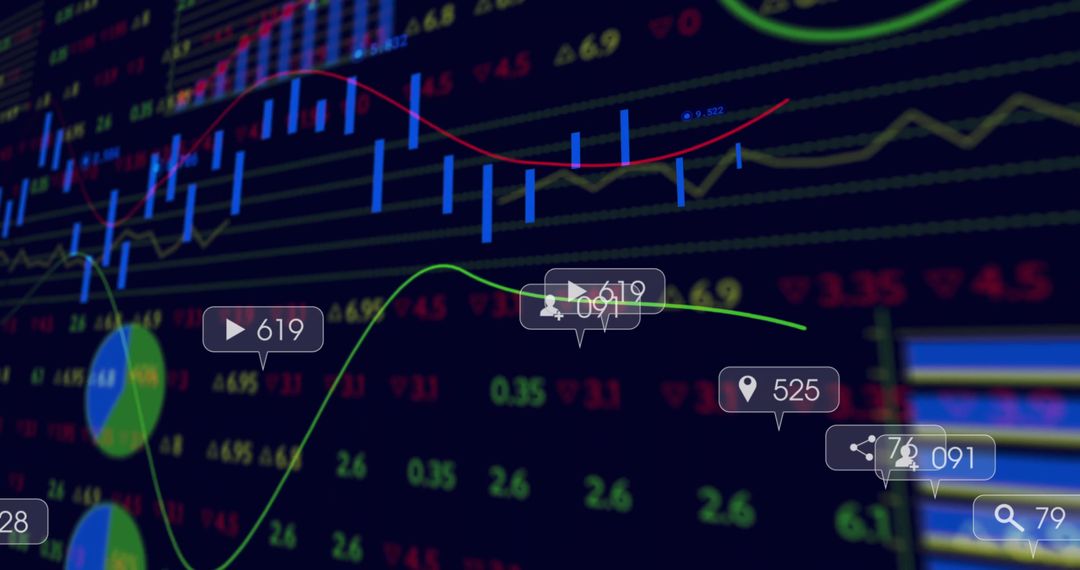
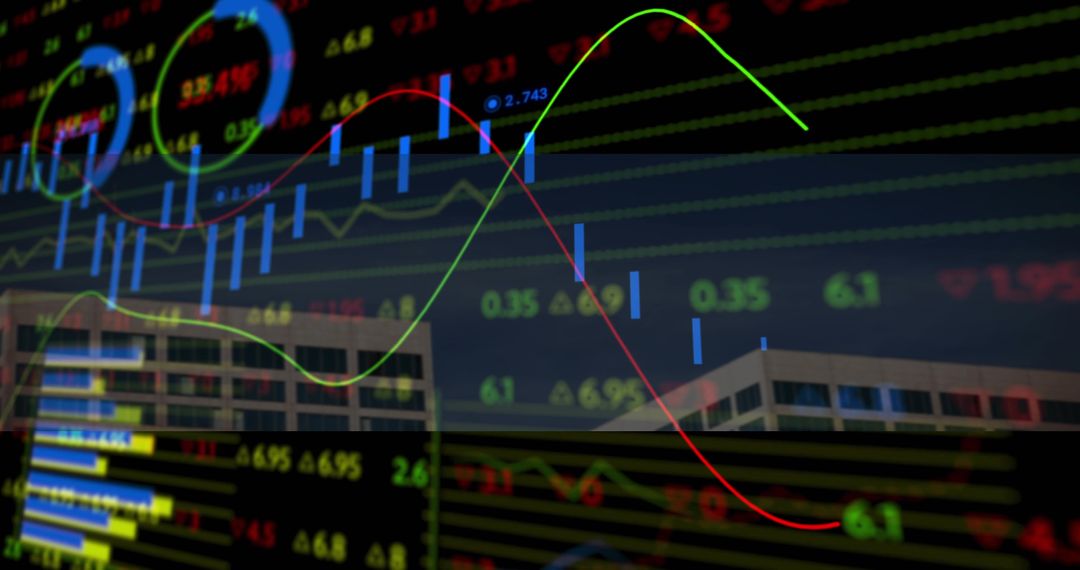
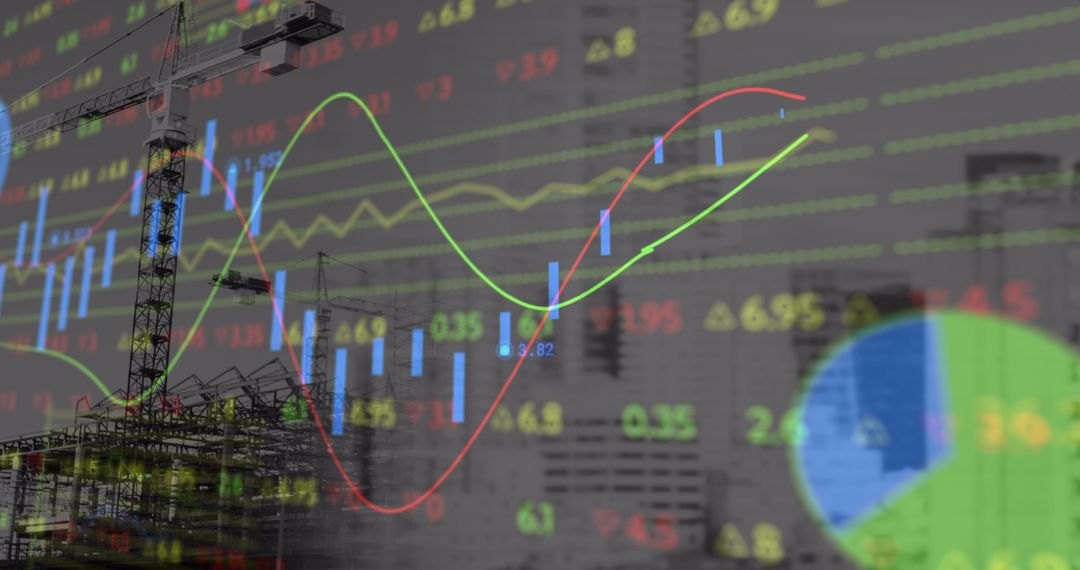
- Global Financial Data Visualization: Dotted Maps with Market Trends
Global Financial Data Visualization: Dotted Maps with Market Trends Image

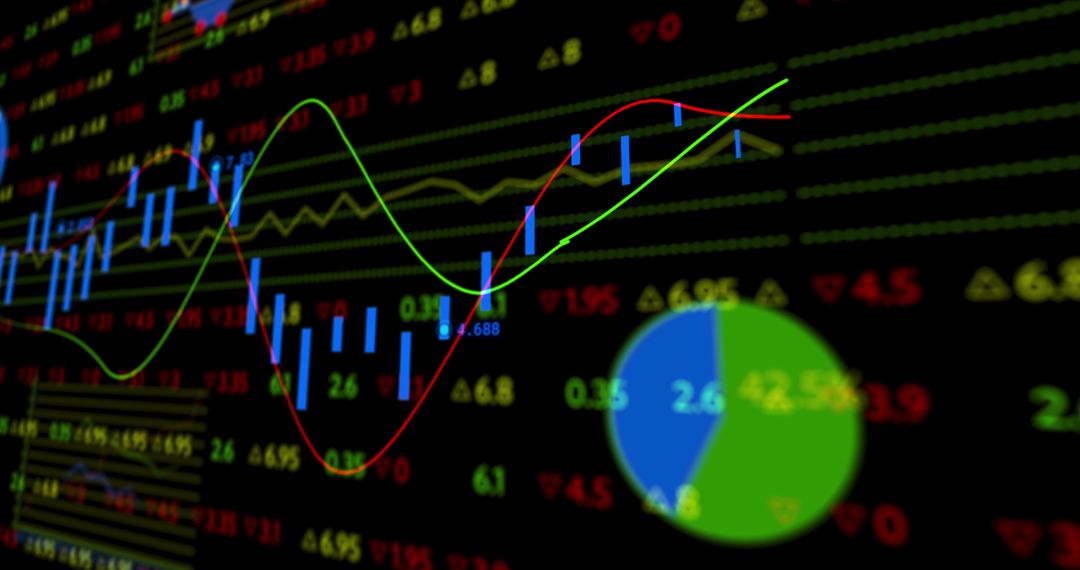
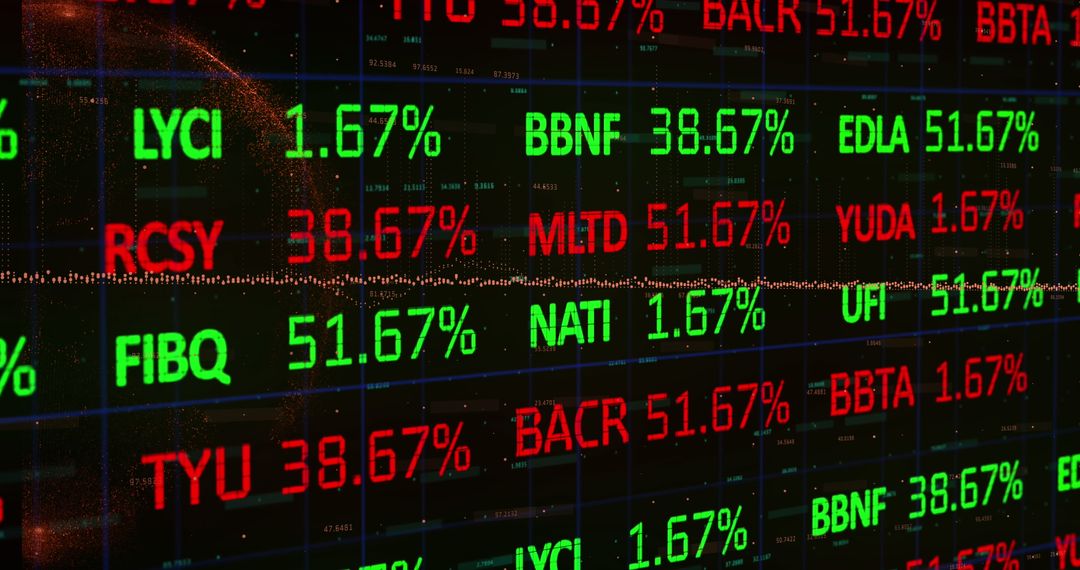
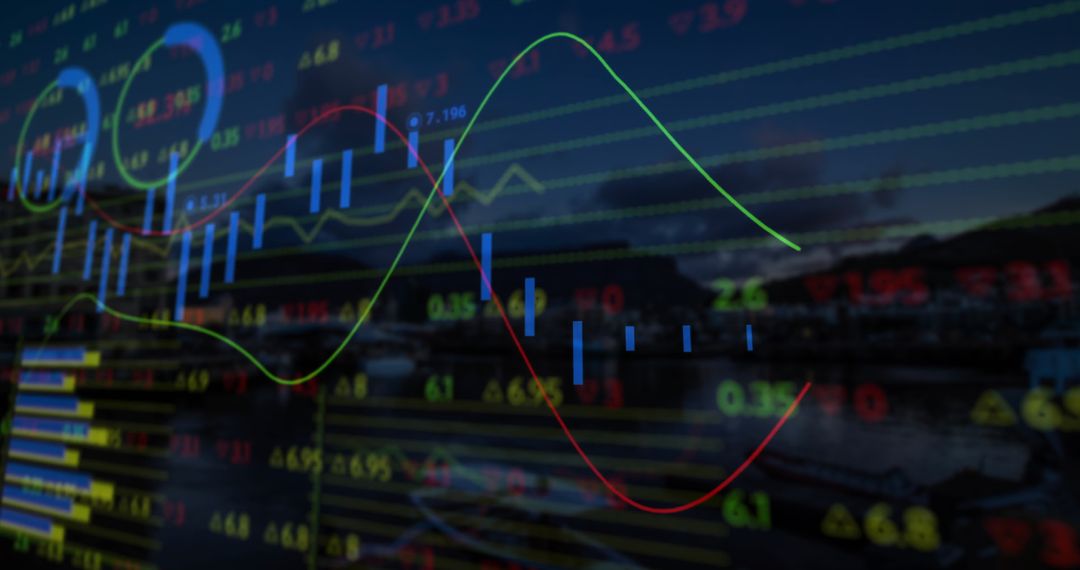
Illustrating global finance through a digital interface, this dynamic content combines a dotted world map with vibrant line and bar charts as well as numerical data. Ideal for articles, presentations, and blogs focusing on financial analytics, economic trends, and investment strategies, the visual encapsulates core elements of data-driven decision making in a global context.
Powered by  - Get 15% off with code: PIKWIZARD15


0
downloads
downloads
Tags:
More
Credit Photo
If you would like to credit the Photo, here are some ways you can do so
Text Link
photo Link
<span class="text-link">
<span>
<a target="_blank" href=https://pikwizard.com/photo/global-financial-data-visualization-dotted-maps-with-market-trends/2490a22ac13d9daa19f1bda303c178bd/>PikWizard</a>
</span>
</span>
<span class="image-link">
<span
style="margin: 0 0 20px 0; display: inline-block; vertical-align: middle; width: 100%;"
>
<a
target="_blank"
href="https://pikwizard.com/photo/global-financial-data-visualization-dotted-maps-with-market-trends/2490a22ac13d9daa19f1bda303c178bd/"
style="text-decoration: none; font-size: 10px; margin: 0;"
>
<img src="https://pikwizard.com/pw/medium/2490a22ac13d9daa19f1bda303c178bd.jpg" style="margin: 0; width: 100%;" alt="" />
<p style="font-size: 12px; margin: 0;">PikWizard</p>
</a>
</span>
</span>
Free (free of charge)
Free for personal and commercial use.
Author: Creative Art
Similar Free Stock Images
Premium


Premium


Premium


Premium


Premium


Premium


Premium


Premium


Premium


Premium


Premium


Premium


Premium


Premium


Premium


Premium


Premium


Premium


Premium


Premium


Premium


Premium


Premium


Premium