- Home >
- Stock Photos >
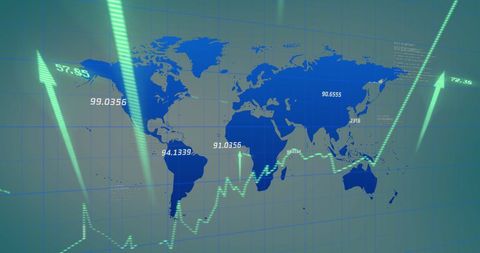
- Global Financial Data Visualization on Digital Interface
Global Financial Data Visualization on Digital Interface Image

Illustration features financial data and graphs superimposed on a translucent world map with a green color scheme. Line graph and statistical data emphasize global financial analytics. Ideal for illustrating topics related to global economics, data-driven decision making, cryptocurrency markets, and fintech innovation.

downloads
Tags:
More
Credit Photo
If you would like to credit the Photo, here are some ways you can do so
Text Link
photo Link
<span class="text-link">
<span>
<a target="_blank" href=https://pikwizard.com/photo/global-financial-data-visualization-on-digital-interface/752b7fadfd50583cf9da2f9d6f820709/>PikWizard</a>
</span>
</span>
<span class="image-link">
<span
style="margin: 0 0 20px 0; display: inline-block; vertical-align: middle; width: 100%;"
>
<a
target="_blank"
href="https://pikwizard.com/photo/global-financial-data-visualization-on-digital-interface/752b7fadfd50583cf9da2f9d6f820709/"
style="text-decoration: none; font-size: 10px; margin: 0;"
>
<img src="https://pikwizard.com/pw/medium/752b7fadfd50583cf9da2f9d6f820709.jpg" style="margin: 0; width: 100%;" alt="" />
<p style="font-size: 12px; margin: 0;">PikWizard</p>
</a>
</span>
</span>
Free (free of charge)
Free for personal and commercial use.
Author: People Creations