- Home >
- Stock Photos >
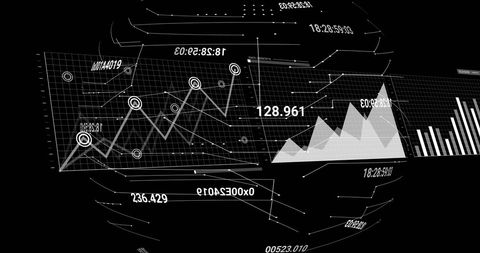
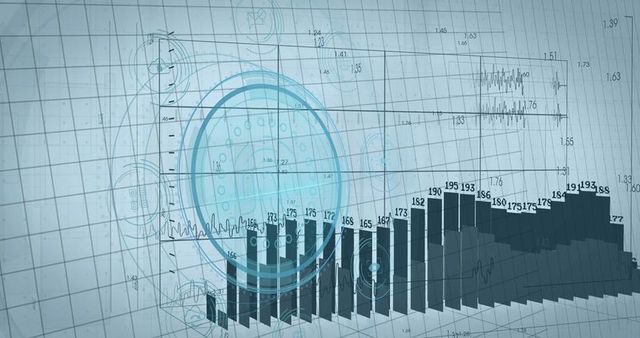
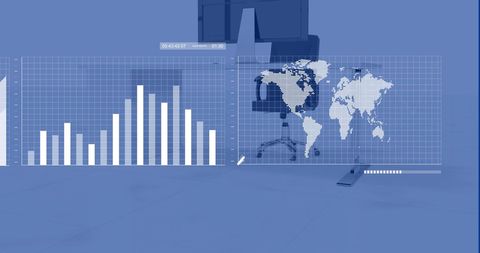
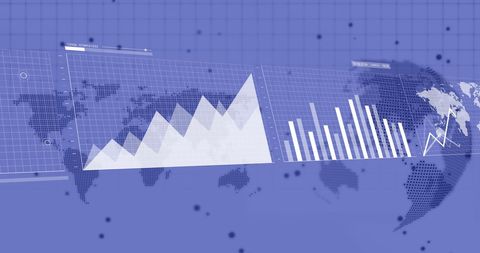
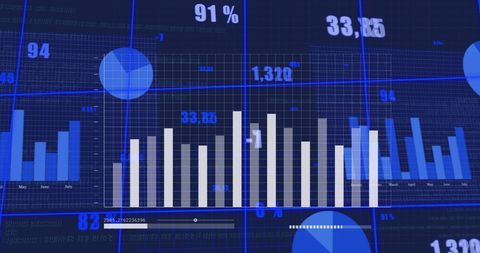
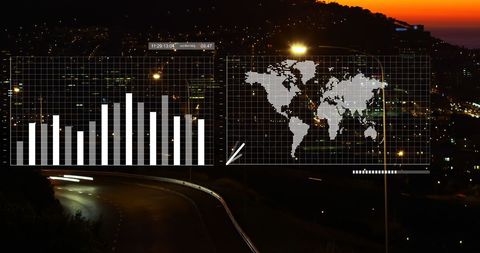
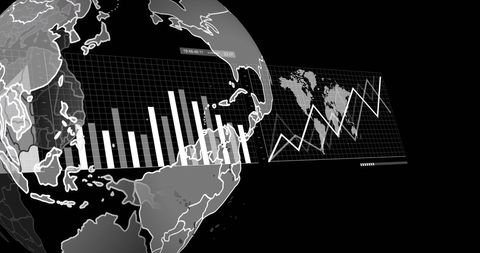
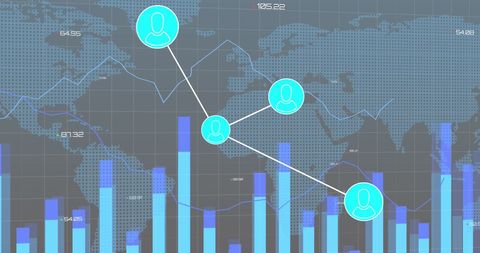
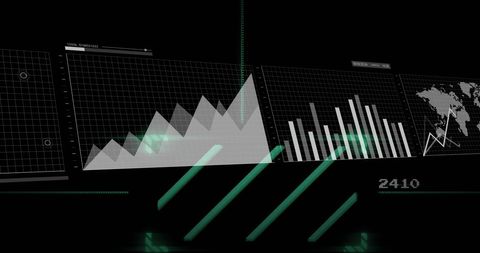
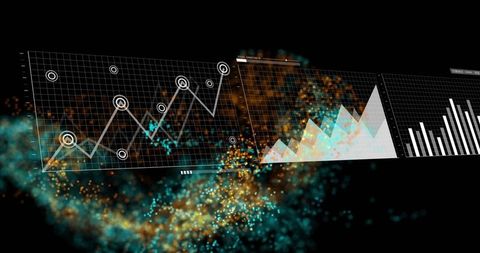
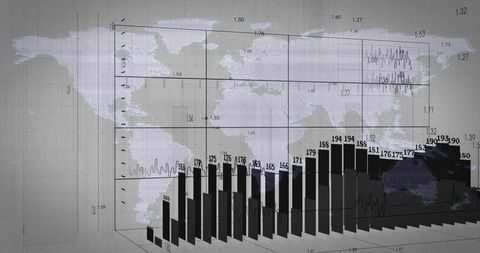
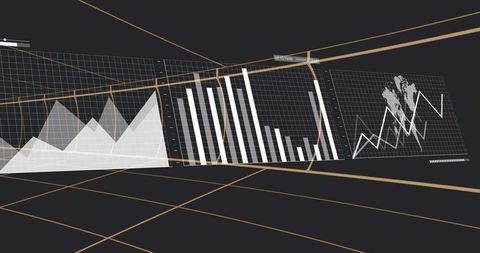
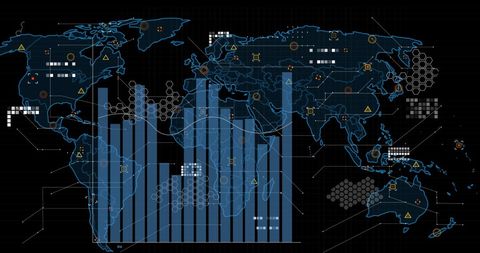
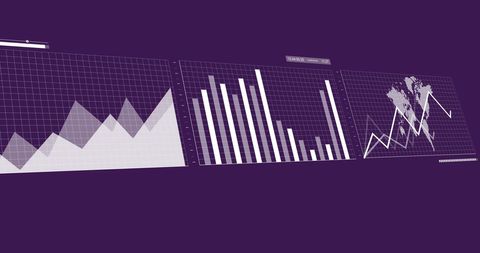
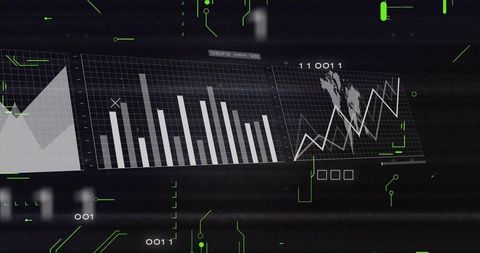
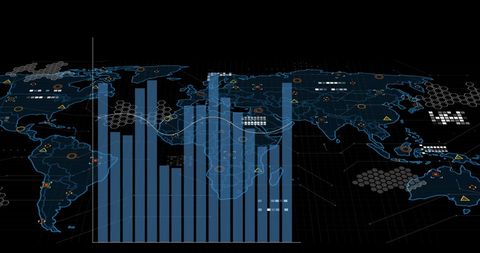
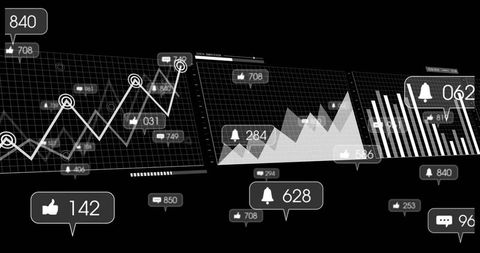
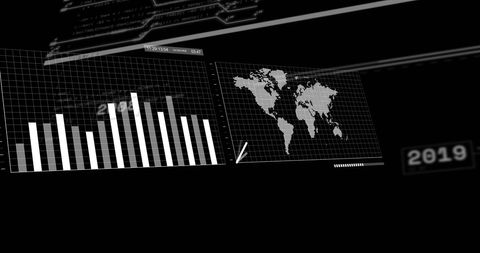
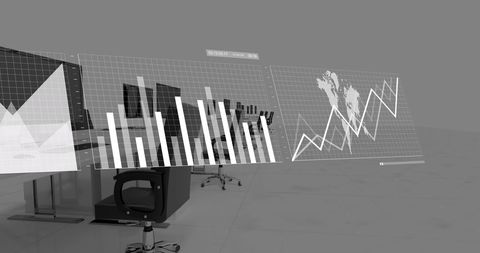
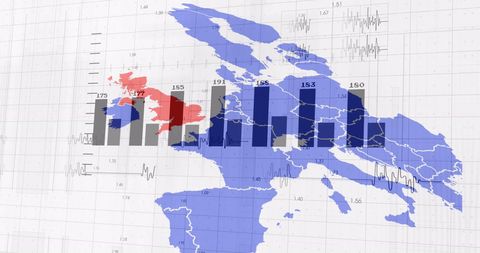
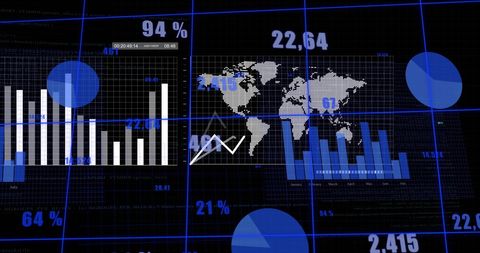
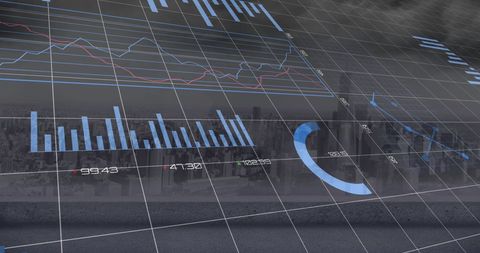
- Global Financial Data Visualization on Digital World Map
Global Financial Data Visualization on Digital World Map Image
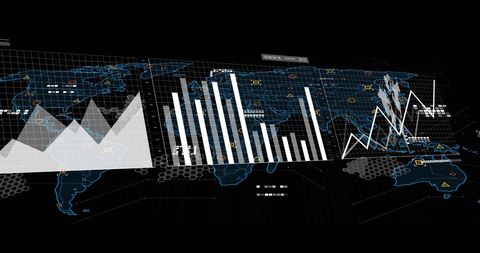
The image depicts complex financial data being showcased on a digital map of the world, illustrating global financial trends and connections. This detailed visualization signifies the dynamic nature of global finance and can be used to highlight concepts like economic trends, global market analytics, and international business strategies. Ideal for use in financial reports, business presentations, technology articles, and educational materials related to economics and data science.

downloads
Tags:
More
Credit Photo
If you would like to credit the Photo, here are some ways you can do so
Text Link
photo Link
<span class="text-link">
<span>
<a target="_blank" href=https://pikwizard.com/photo/global-financial-data-visualization-on-digital-world-map/e9f7723285620d109d42d1bd8f92d308/>PikWizard</a>
</span>
</span>
<span class="image-link">
<span
style="margin: 0 0 20px 0; display: inline-block; vertical-align: middle; width: 100%;"
>
<a
target="_blank"
href="https://pikwizard.com/photo/global-financial-data-visualization-on-digital-world-map/e9f7723285620d109d42d1bd8f92d308/"
style="text-decoration: none; font-size: 10px; margin: 0;"
>
<img src="https://pikwizard.com/pw/medium/e9f7723285620d109d42d1bd8f92d308.jpg" style="margin: 0; width: 100%;" alt="" />
<p style="font-size: 12px; margin: 0;">PikWizard</p>
</a>
</span>
</span>
Free (free of charge)
Free for personal and commercial use.
Author: People Creations