- Home >
- Stock Photos >
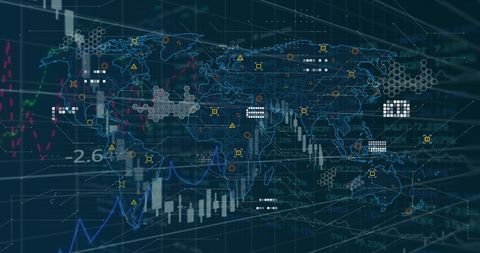
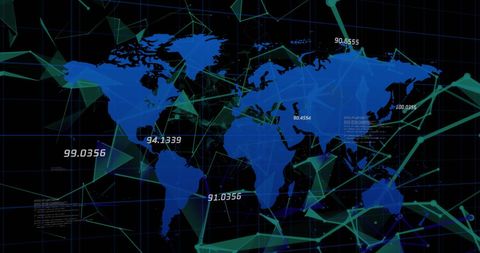
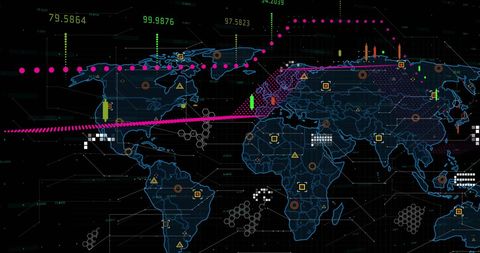
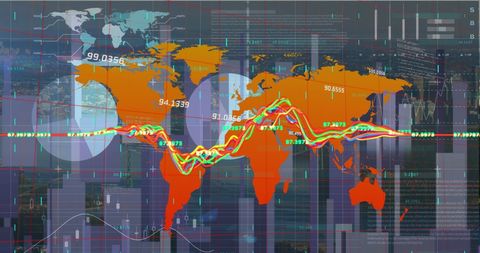
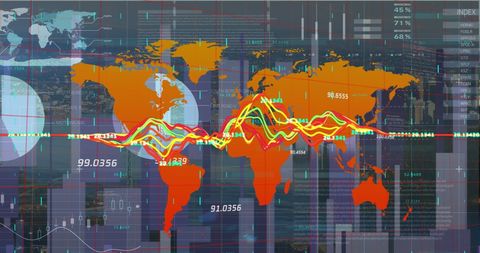
- Global Financial Data Visualization on World Map Interface
Global Financial Data Visualization on World Map Interface Image

Visualizing financial trends across a global map interface highlights economic data patterns and insights. Ideal for presentations on global markets, finance trends, or cybersecurity. Useful in fintech reports and global economic analyses to illustrate complex, interrelated data flows.

downloads
Tags:
More
Credit Photo
If you would like to credit the Photo, here are some ways you can do so
Text Link
photo Link
<span class="text-link">
<span>
<a target="_blank" href=https://pikwizard.com/photo/global-financial-data-visualization-on-world-map-interface/0077aff732c6483891d0aeb9a0b7e5c6/>PikWizard</a>
</span>
</span>
<span class="image-link">
<span
style="margin: 0 0 20px 0; display: inline-block; vertical-align: middle; width: 100%;"
>
<a
target="_blank"
href="https://pikwizard.com/photo/global-financial-data-visualization-on-world-map-interface/0077aff732c6483891d0aeb9a0b7e5c6/"
style="text-decoration: none; font-size: 10px; margin: 0;"
>
<img src="https://pikwizard.com/pw/medium/0077aff732c6483891d0aeb9a0b7e5c6.jpg" style="margin: 0; width: 100%;" alt="" />
<p style="font-size: 12px; margin: 0;">PikWizard</p>
</a>
</span>
</span>
Free (free of charge)
Free for personal and commercial use.
Author: People Creations