
- Home >
- Stock Photos >
- Global Financial Data Visualization Over Urban Traffic
Global Financial Data Visualization Over Urban Traffic Image
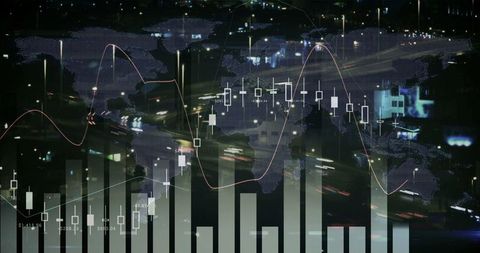
This illustration merges global financial data with a nighttime urban environment, showcasing candlestick charts over city lights. Ideal for conveying themes of international finance, economic analysis, and technological progress in a visually compelling way. Suitable for presentations, financial services, and educational content focusing on data visualization, urbanization, and global economy trends.

downloads
Tags:
More
Credit Photo
If you would like to credit the Photo, here are some ways you can do so
Text Link
photo Link
<span class="text-link">
<span>
<a target="_blank" href=https://pikwizard.com/photo/global-financial-data-visualization-over-urban-traffic/b1b76ca4e12760c9da49584bc9935571/>PikWizard</a>
</span>
</span>
<span class="image-link">
<span
style="margin: 0 0 20px 0; display: inline-block; vertical-align: middle; width: 100%;"
>
<a
target="_blank"
href="https://pikwizard.com/photo/global-financial-data-visualization-over-urban-traffic/b1b76ca4e12760c9da49584bc9935571/"
style="text-decoration: none; font-size: 10px; margin: 0;"
>
<img src="https://pikwizard.com/pw/medium/b1b76ca4e12760c9da49584bc9935571.jpg" style="margin: 0; width: 100%;" alt="" />
<p style="font-size: 12px; margin: 0;">PikWizard</p>
</a>
</span>
</span>
Free (free of charge)
Free for personal and commercial use.
Author: Creative Art