- Home >
- Stock Photos >
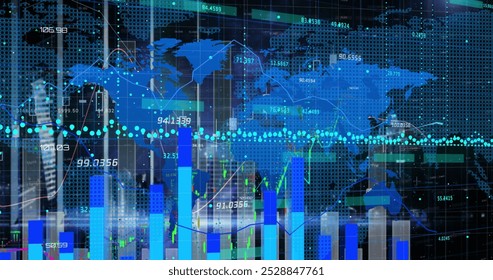
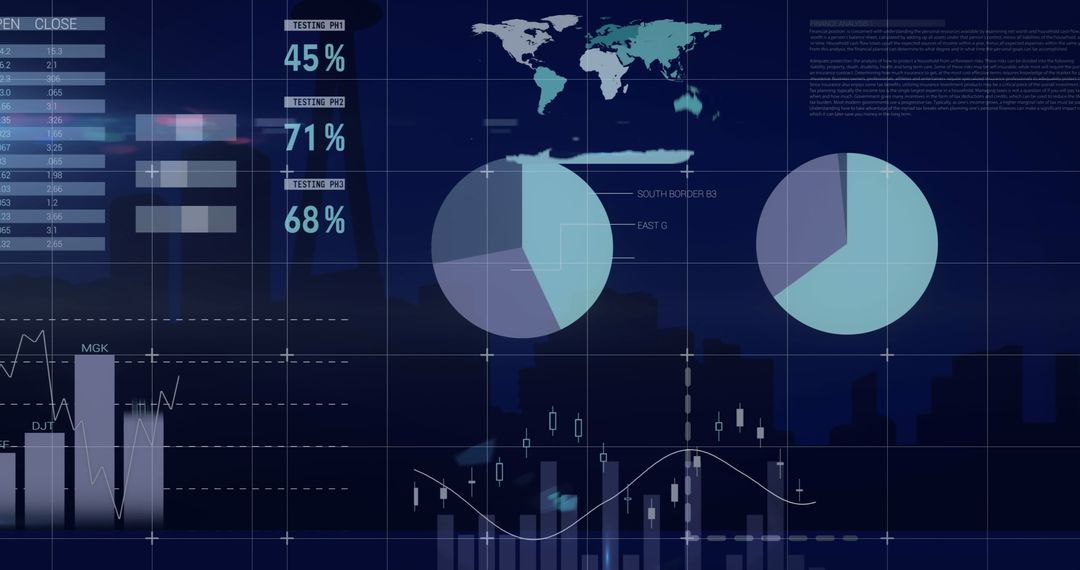
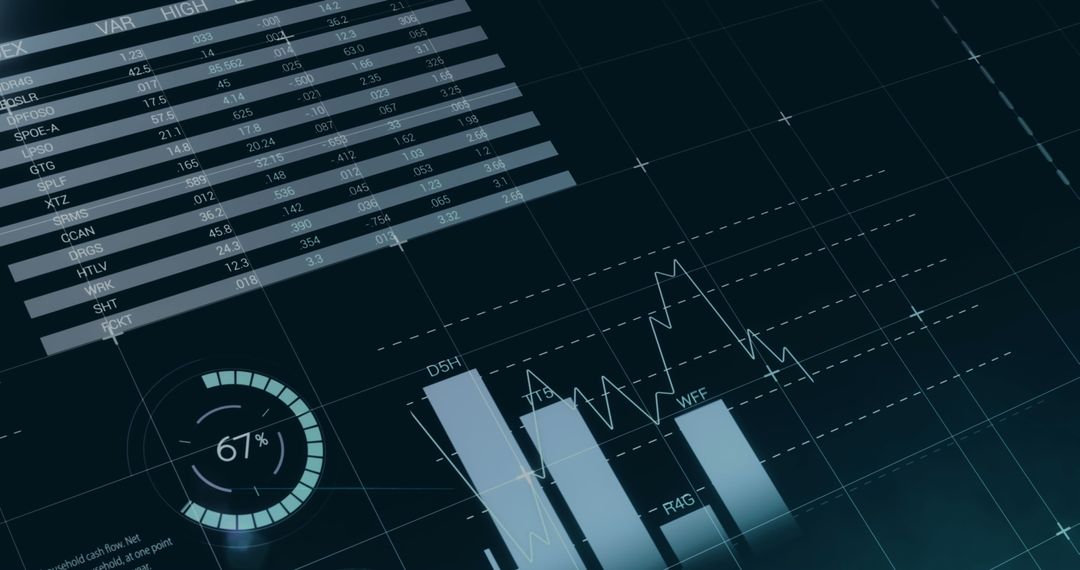
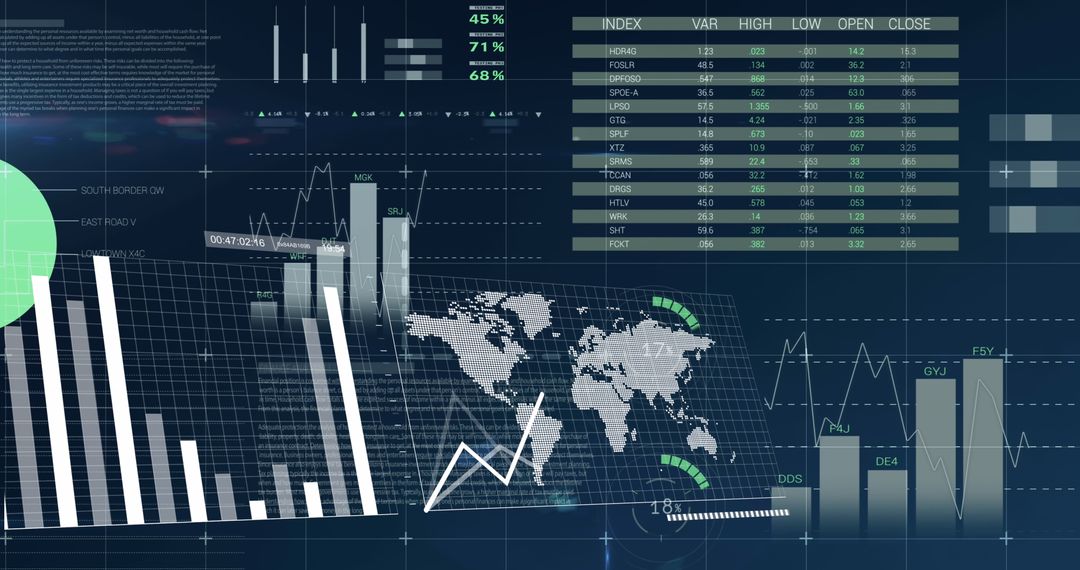
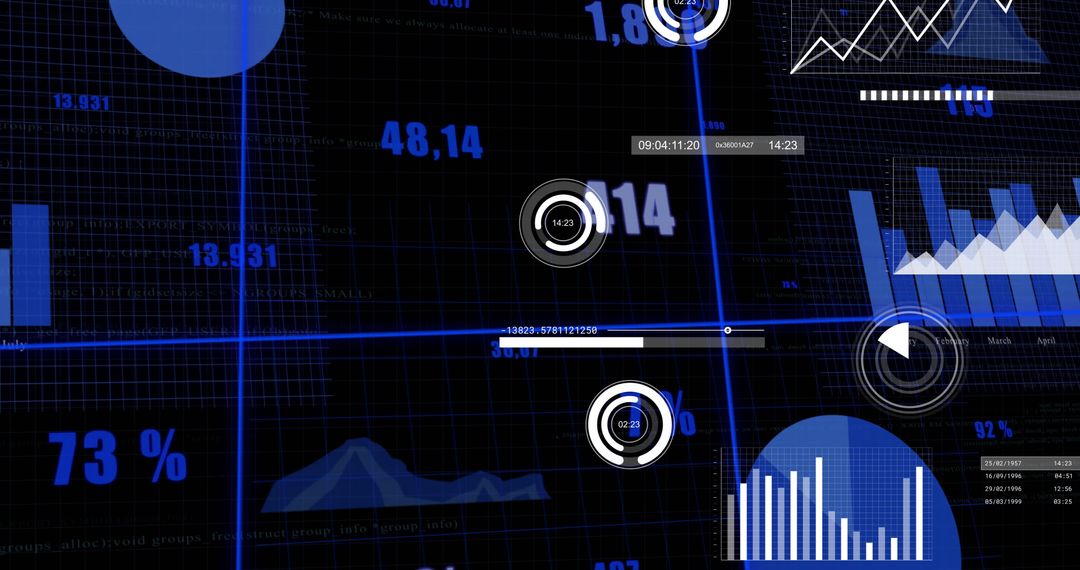
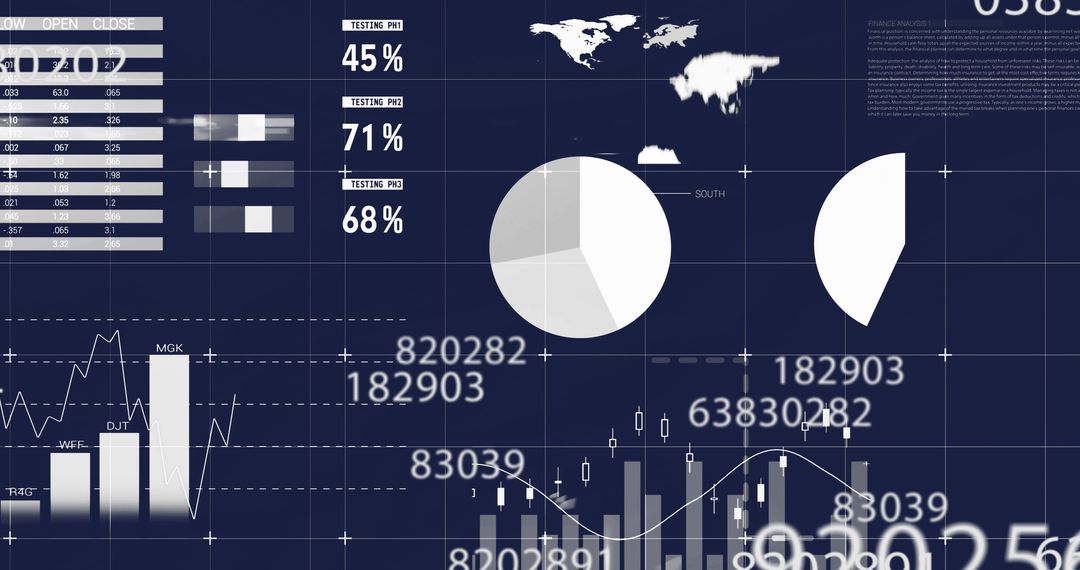
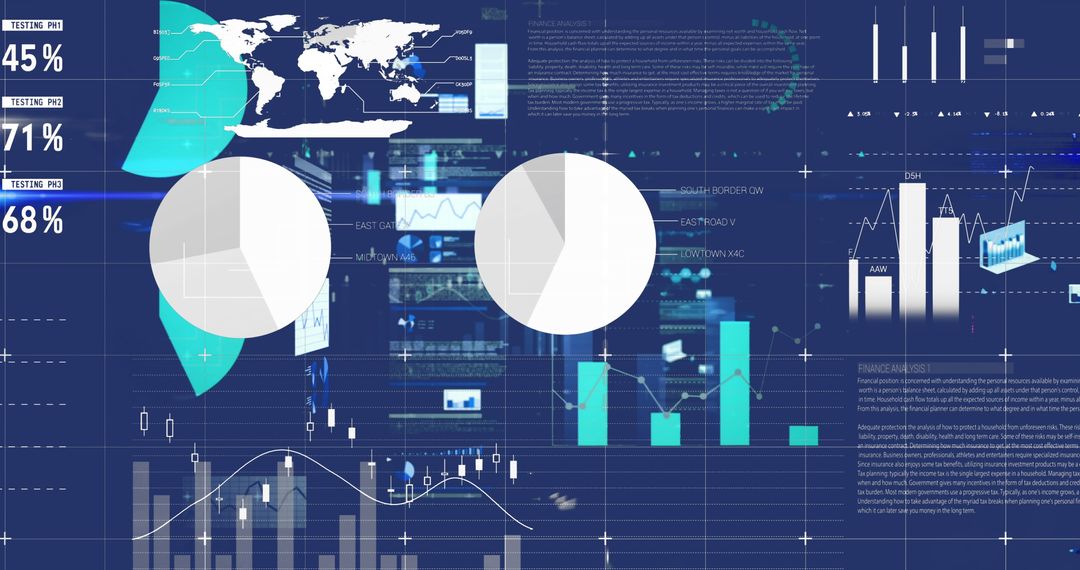
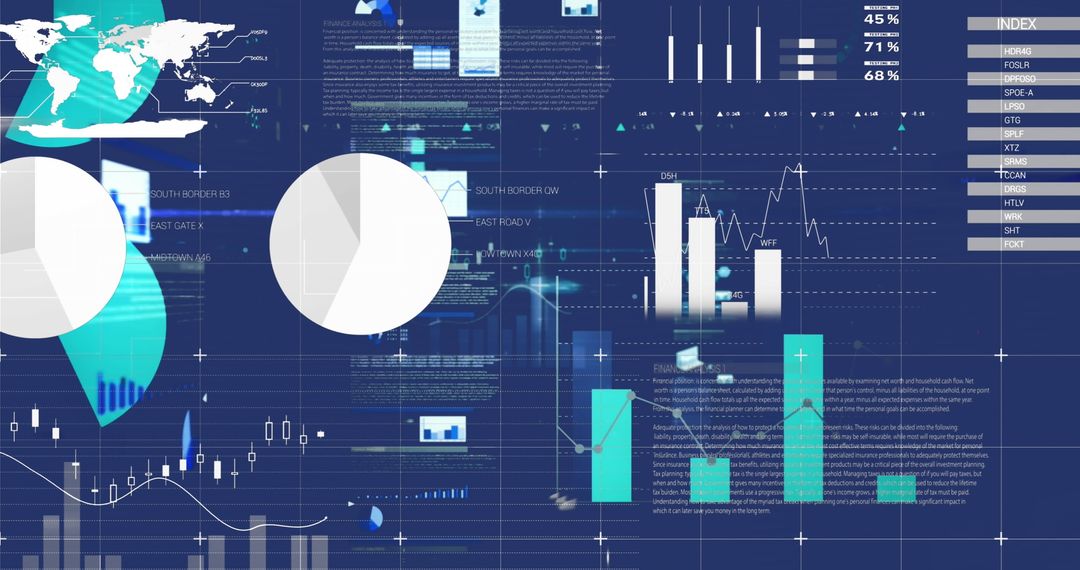
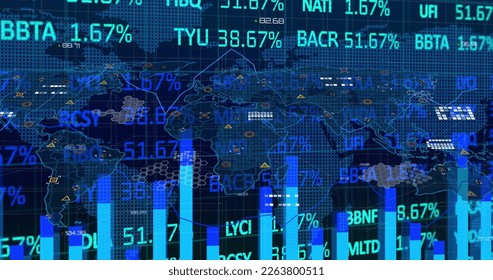
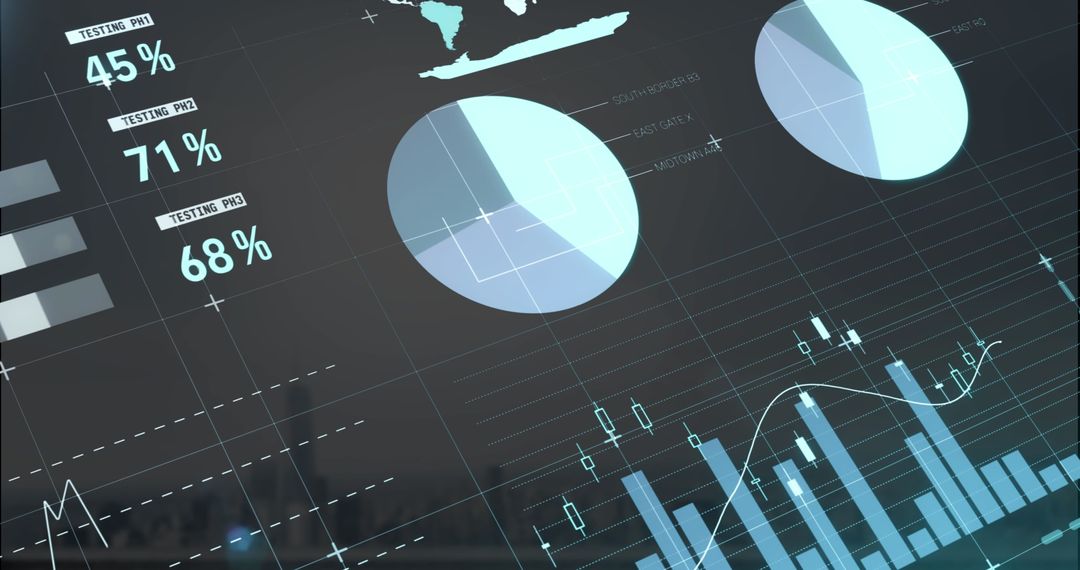
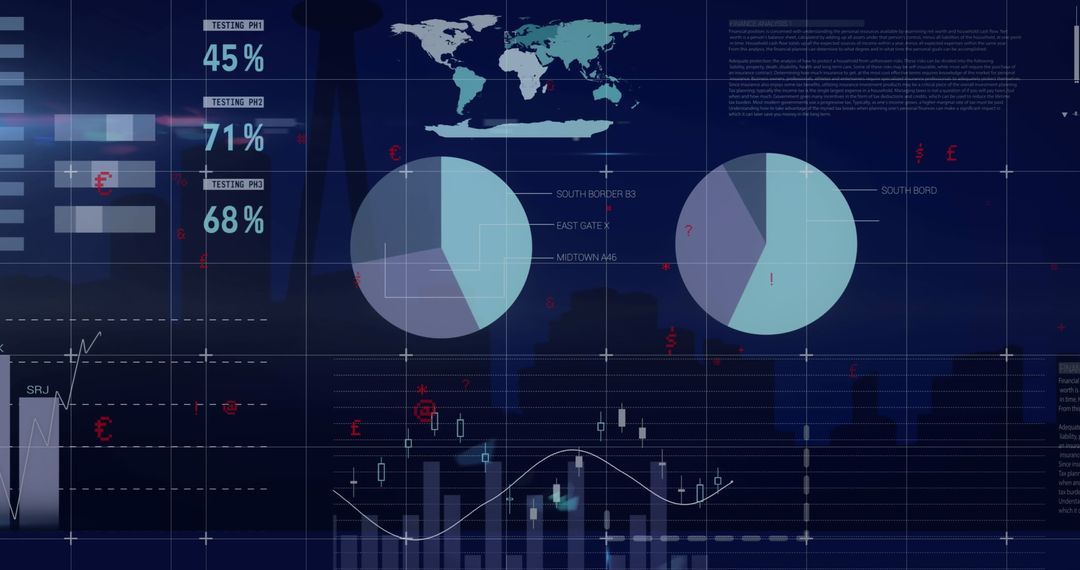
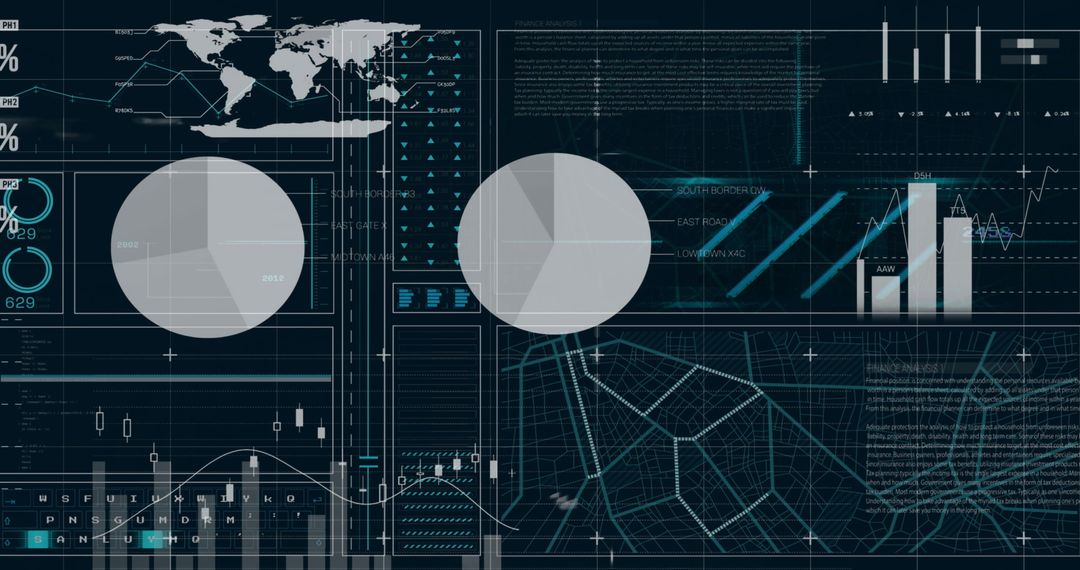
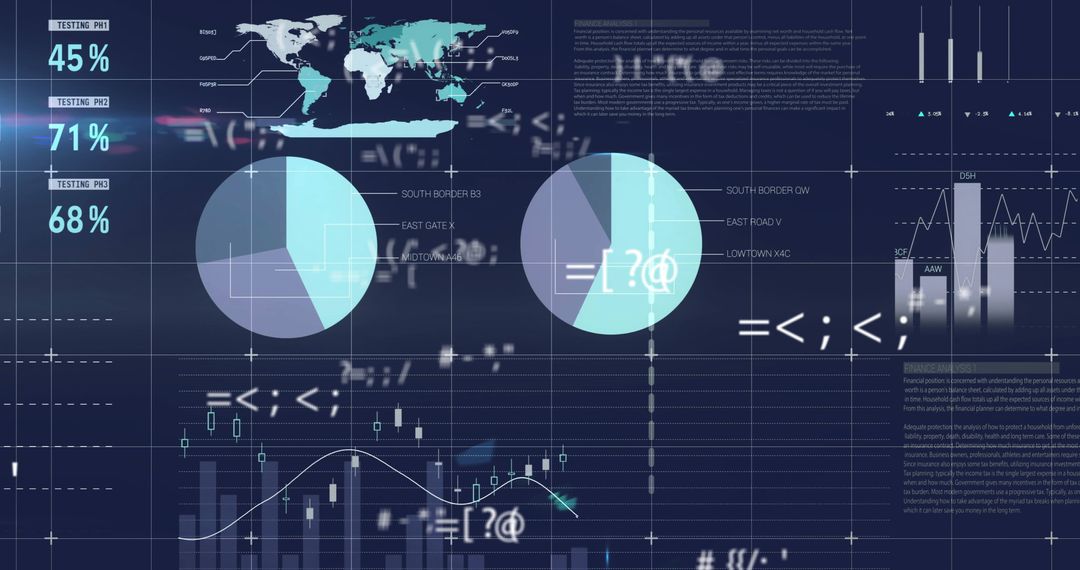
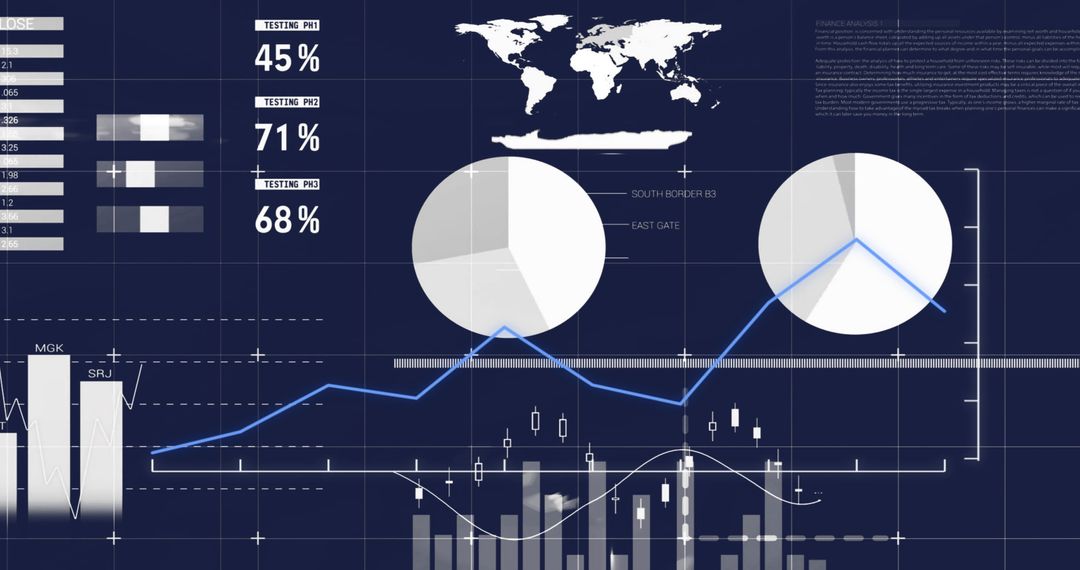
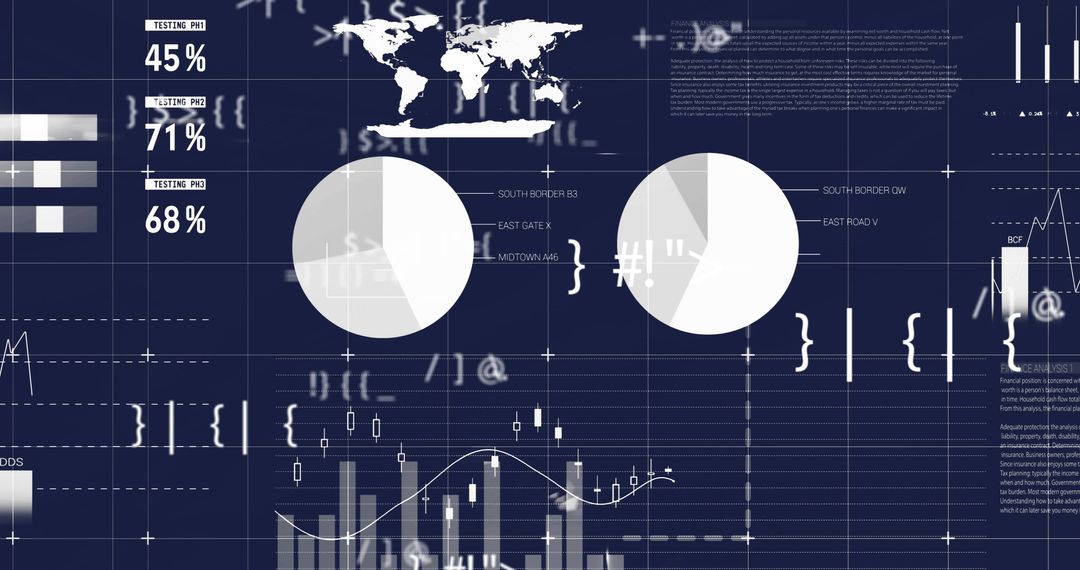
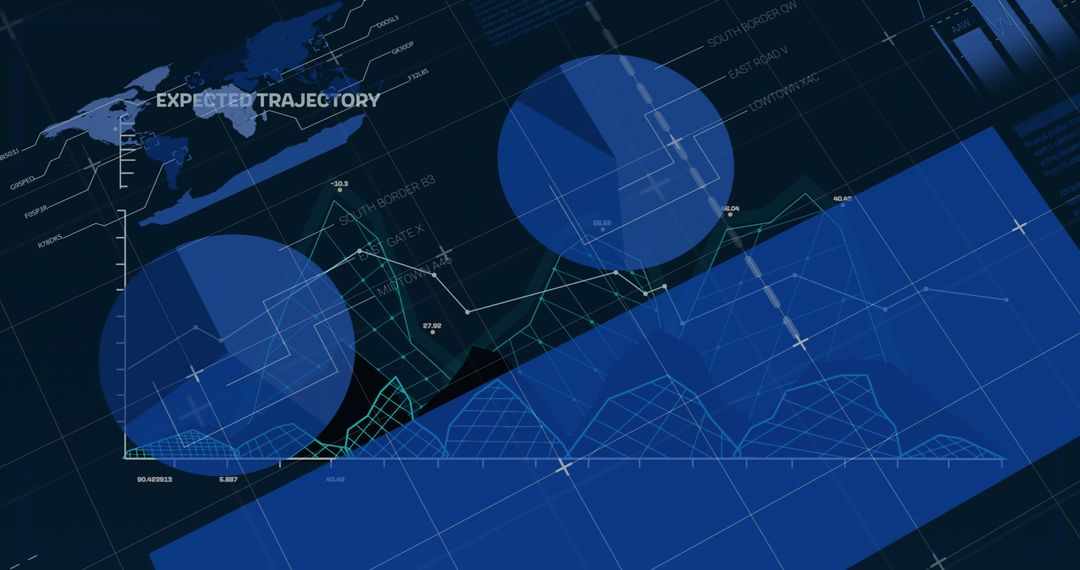
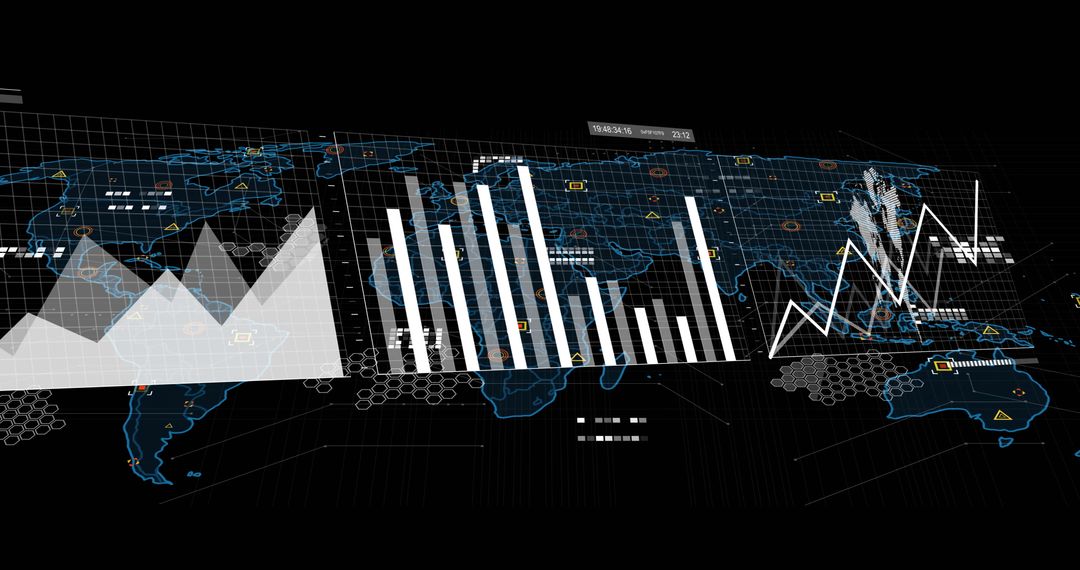
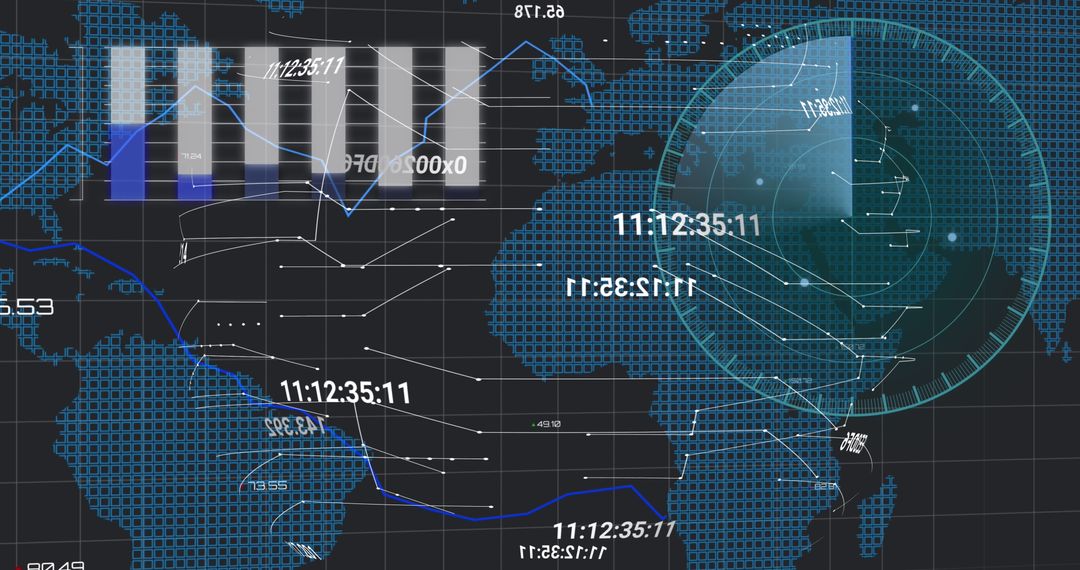
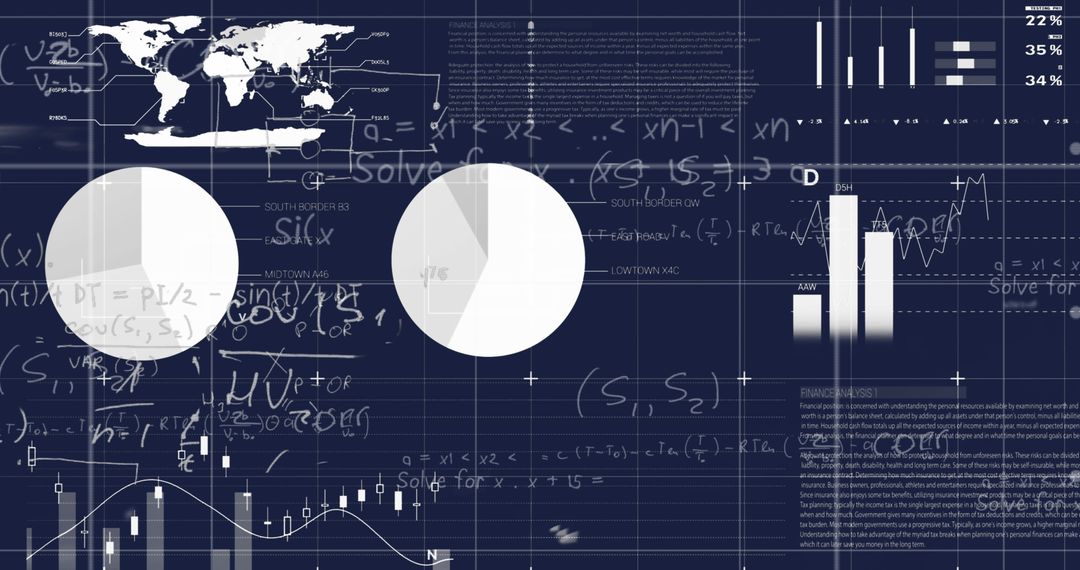
- Global Financial Data Visualization with Bar and Line Graphs
Global Financial Data Visualization with Bar and Line Graphs Image

Visual interpretation of global financial data incorporating world map, bar and line graphs depicting trade or economic trends with digital network patterns. Useful for illustrating presentations on global market analysis, financial forecasting, or digital technology strategies.
Powered by  - Get 15% off with code: PIKWIZARD15


2
downloads
downloads
Tags:
More
Credit Photo
If you would like to credit the Photo, here are some ways you can do so
Text Link
photo Link
<span class="text-link">
<span>
<a target="_blank" href=https://pikwizard.com/photo/global-financial-data-visualization-with-bar-and-line-graphs/d06696f6efdc58a9a49356543c664d37/>PikWizard</a>
</span>
</span>
<span class="image-link">
<span
style="margin: 0 0 20px 0; display: inline-block; vertical-align: middle; width: 100%;"
>
<a
target="_blank"
href="https://pikwizard.com/photo/global-financial-data-visualization-with-bar-and-line-graphs/d06696f6efdc58a9a49356543c664d37/"
style="text-decoration: none; font-size: 10px; margin: 0;"
>
<img src="https://pikwizard.com/pw/medium/d06696f6efdc58a9a49356543c664d37.jpg" style="margin: 0; width: 100%;" alt="" />
<p style="font-size: 12px; margin: 0;">PikWizard</p>
</a>
</span>
</span>
Free (free of charge)
Free for personal and commercial use.
Author: Authentic Images
Similar Free Stock Images

Premium


Premium


Premium


Premium


Premium


Premium


Premium


Premium


Premium


Premium


Premium


Premium


Premium


Premium


Premium


Premium


Premium

Premium


Premium


Premium


Premium


Premium


Premium


Premium