
- Home >
- Stock Photos >
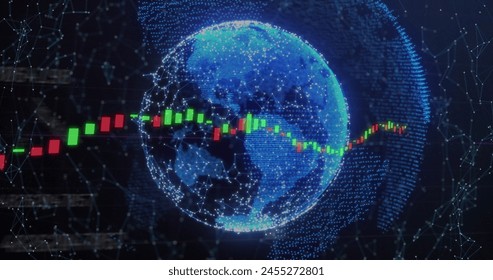
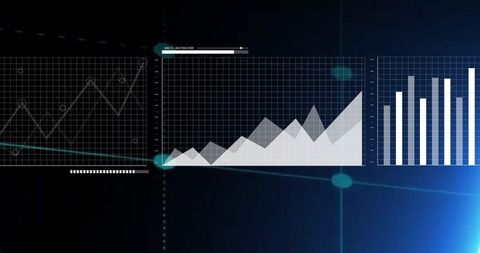
- Global Financial Data Visualization with Charts and Graphs
Global Financial Data Visualization with Charts and Graphs Image

Depicts financial data integration and global connections using digital charts and visualizations, with Earth globe symbolizing international business. Suitable for illustrating economic articles, presentations on business growth, or technology in finance sector. Ideal for depicting concept of globalization and financial analytics.
Powered by  - Get 15% off with code: PIKWIZARD15


downloads
Tags:
More
Credit Photo
If you would like to credit the Photo, here are some ways you can do so
Text Link
photo Link
<span class="text-link">
<span>
<a target="_blank" href=https://pikwizard.com/photo/global-financial-data-visualization-with-charts-and-graphs/502cf6993e09bcbaa6640d538118bccd/>PikWizard</a>
</span>
</span>
<span class="image-link">
<span
style="margin: 0 0 20px 0; display: inline-block; vertical-align: middle; width: 100%;"
>
<a
target="_blank"
href="https://pikwizard.com/photo/global-financial-data-visualization-with-charts-and-graphs/502cf6993e09bcbaa6640d538118bccd/"
style="text-decoration: none; font-size: 10px; margin: 0;"
>
<img src="https://pikwizard.com/pw/medium/502cf6993e09bcbaa6640d538118bccd.jpg" style="margin: 0; width: 100%;" alt="" />
<p style="font-size: 12px; margin: 0;">PikWizard</p>
</a>
</span>
</span>
Free (free of charge)
Free for personal and commercial use.
Author: People Creations
Similar Free Stock Images

Premium


Premium

Premium


Premium


Premium

Premium


Premium


Premium


Premium


Premium
Premium

Premium


Premium


Premium


Premium


Premium


Premium


Premium


Premium

Premium


Premium


Premium


Premium


Premium


Premium

Explore More Free Stock Images