- Home >
- Stock Photos >
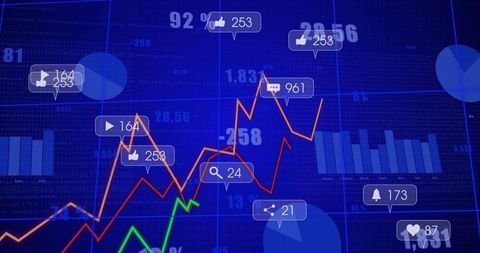
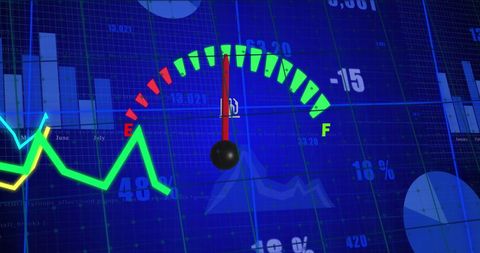
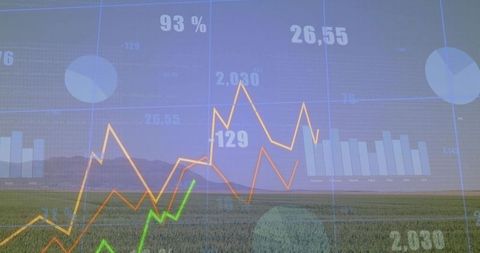
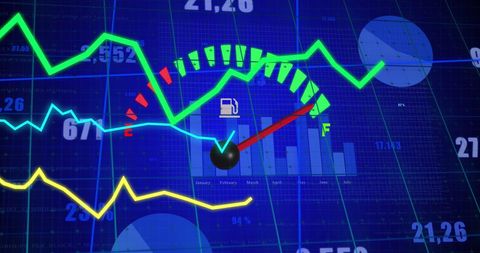
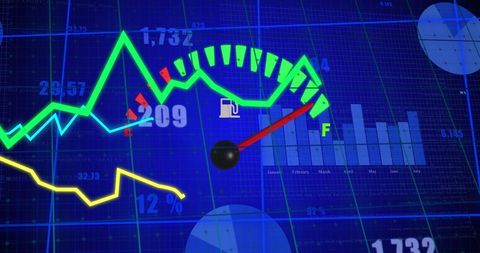
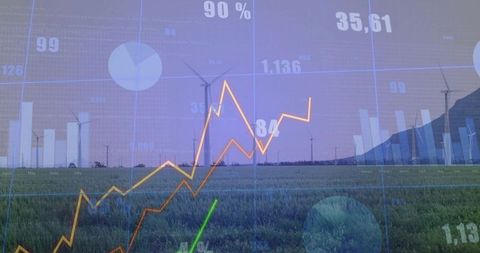
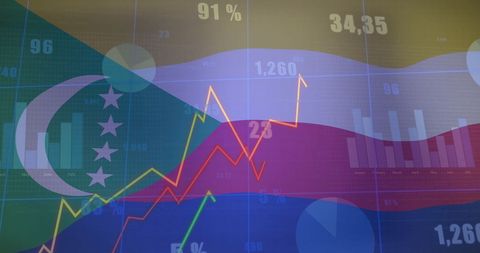
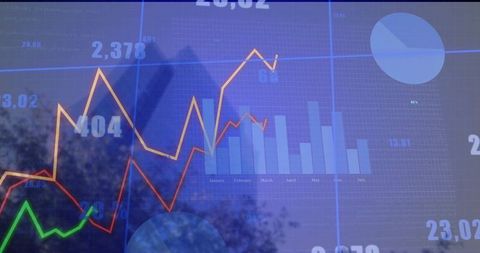
- Global Financial Data Visualization with Charts and World Map
Global Financial Data Visualization with Charts and World Map Image

Colorful and dynamic visualization combining line and bar charts with a world map, ideal for presentations and reports focused on global financial trends and data analytics. Useful for financial analysts, business consultants, and market researchers to illustrate economic strategies or market insights.

downloads
Tags:
More
Credit Photo
If you would like to credit the Photo, here are some ways you can do so
Text Link
photo Link
<span class="text-link">
<span>
<a target="_blank" href=https://pikwizard.com/photo/global-financial-data-visualization-with-charts-and-world-map/0c35fd0fc4a8be42110adabb8251a8e6/>PikWizard</a>
</span>
</span>
<span class="image-link">
<span
style="margin: 0 0 20px 0; display: inline-block; vertical-align: middle; width: 100%;"
>
<a
target="_blank"
href="https://pikwizard.com/photo/global-financial-data-visualization-with-charts-and-world-map/0c35fd0fc4a8be42110adabb8251a8e6/"
style="text-decoration: none; font-size: 10px; margin: 0;"
>
<img src="https://pikwizard.com/pw/medium/0c35fd0fc4a8be42110adabb8251a8e6.jpg" style="margin: 0; width: 100%;" alt="" />
<p style="font-size: 12px; margin: 0;">PikWizard</p>
</a>
</span>
</span>
Free (free of charge)
Free for personal and commercial use.
Author: Authentic Images