
- Home >
- Stock Photos >
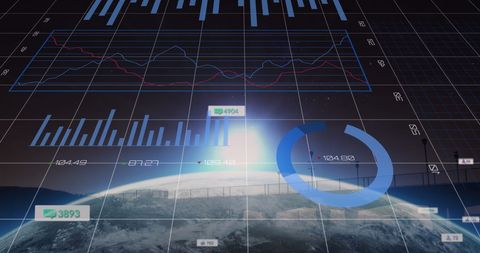
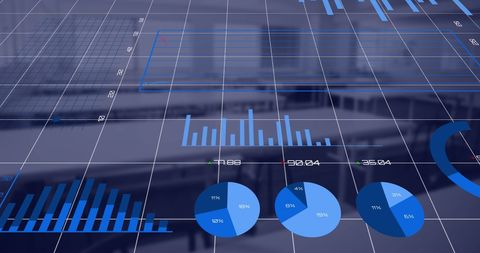
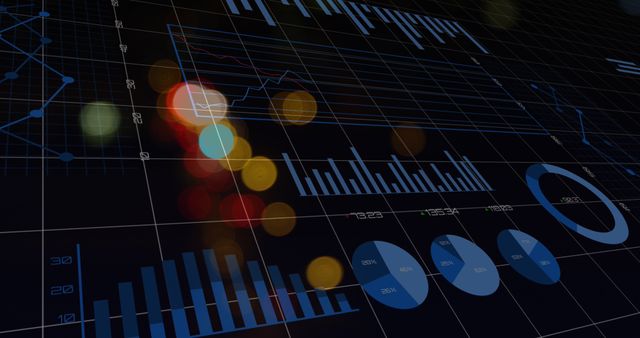
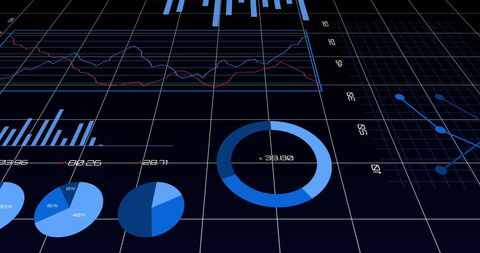
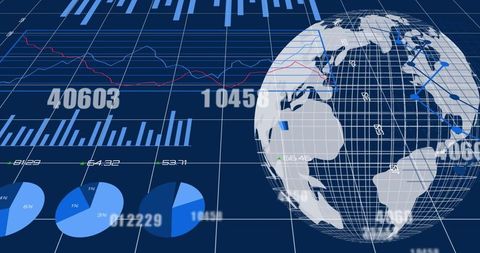
- Global Financial Data Visualization with Charts on Digital Map
Global Financial Data Visualization with Charts on Digital Map Image

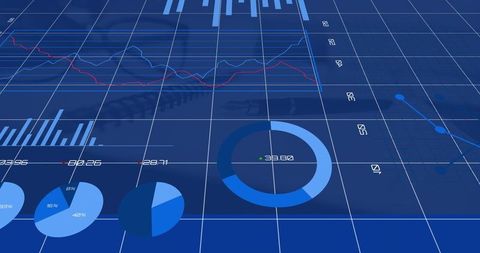
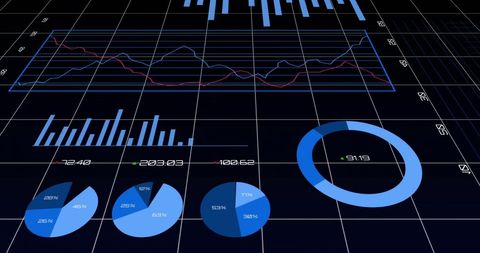
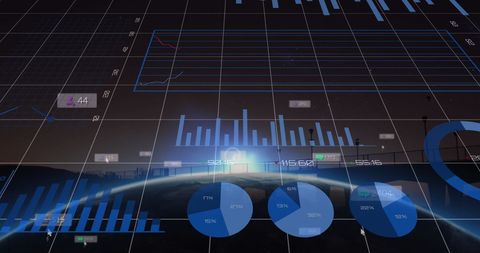
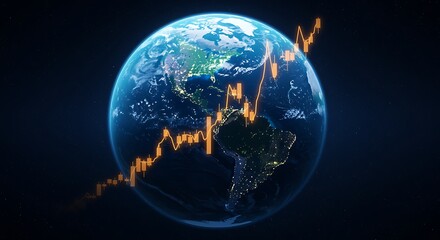
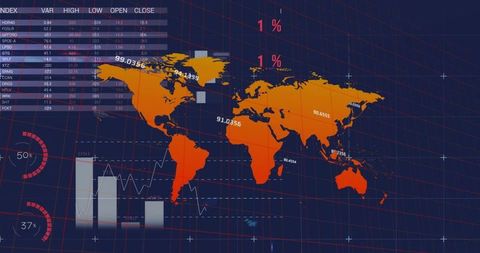
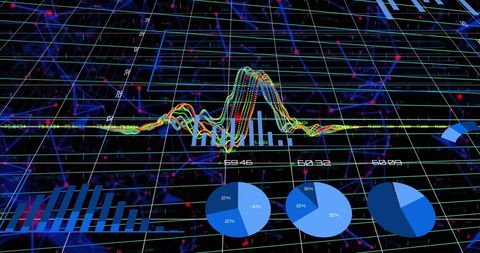
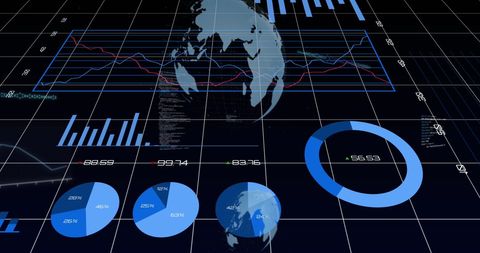
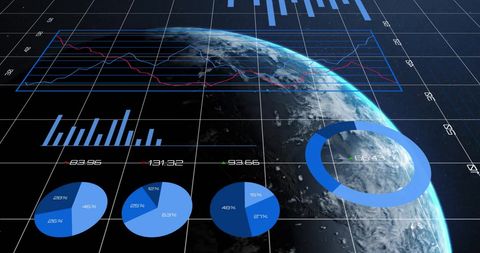
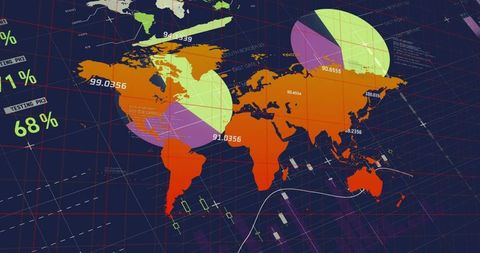
Global financial data visualization showcases an array of charts and graphs superimposed on a digital world map, encapsulating themes of finance, analytics and technology. Helpful for presentations relating to global market trends, economic reports, and financial forecasts. Ideal for digital assets in financial services, business meetings, corporate presentations and tech-related content.
Powered by 


downloads
Tags:
More
Credit Photo
If you would like to credit the Photo, here are some ways you can do so
Text Link
photo Link
<span class="text-link">
<span>
<a target="_blank" href=https://pikwizard.com/photo/global-financial-data-visualization-with-charts-on-digital-map/4f3c4cc5ce258f475df568cf010469f4/>PikWizard</a>
</span>
</span>
<span class="image-link">
<span
style="margin: 0 0 20px 0; display: inline-block; vertical-align: middle; width: 100%;"
>
<a
target="_blank"
href="https://pikwizard.com/photo/global-financial-data-visualization-with-charts-on-digital-map/4f3c4cc5ce258f475df568cf010469f4/"
style="text-decoration: none; font-size: 10px; margin: 0;"
>
<img src="https://pikwizard.com/pw/medium/4f3c4cc5ce258f475df568cf010469f4.jpg" style="margin: 0; width: 100%;" alt="" />
<p style="font-size: 12px; margin: 0;">PikWizard</p>
</a>
</span>
</span>
Free (free of charge)
Free for personal and commercial use.
Author: People Creations
Similar Free Stock Images

Premium

Premium

Premium


Premium


Premium

Premium

Premium


Premium

Premium


Premium

Premium
Premium

Premium


Premium

Premium


Premium


Premium


Premium


Premium


Premium


Premium


Premium


Premium

Premium

Premium


Explore More Free Stock Images