
- Home >
- Stock Photos >
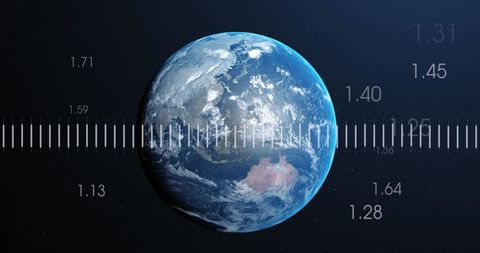
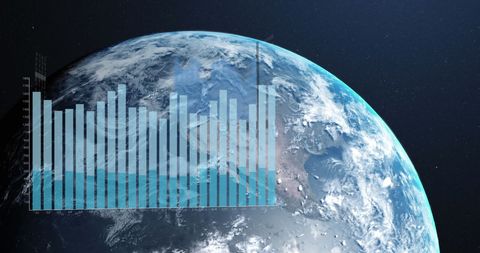
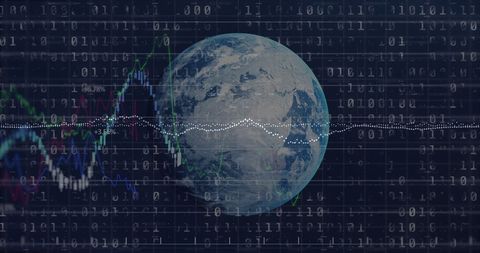
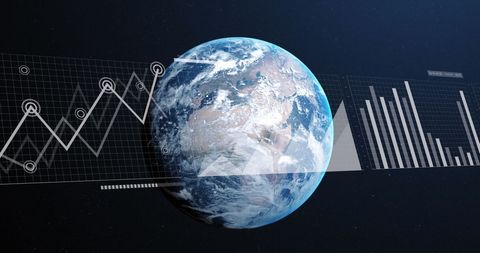
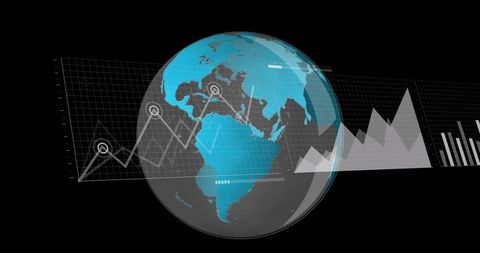
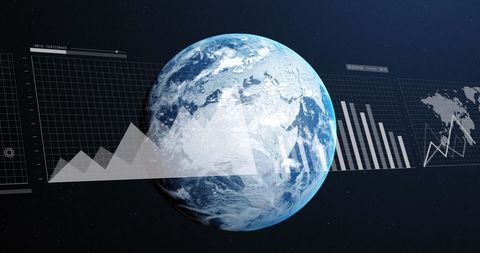
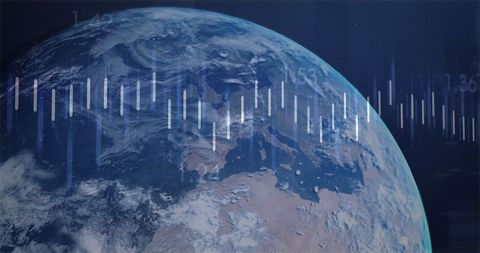
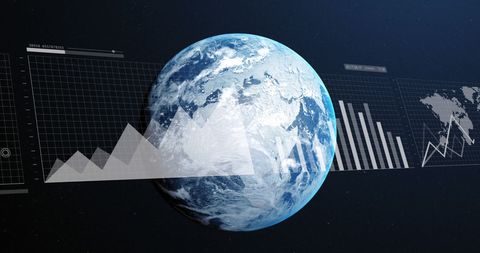
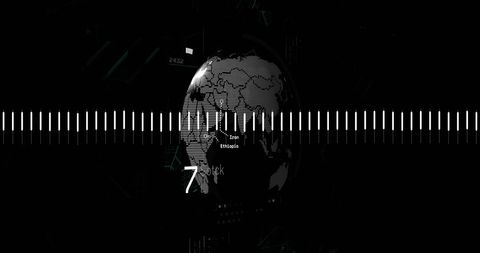
- Global Financial Data Visualization with Graphs
Global Financial Data Visualization with Graphs Image
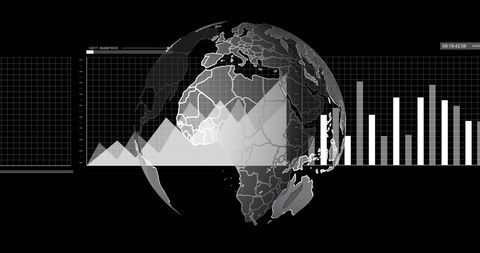
Financial graphs superimposed on a globe over a black background visually represents global financial transactions and data analysis. Elements suggest global connectivity in international business contexts. Ideal for multimedia uses in finance communications, seminars, business publications, and digital presentations focused on financial technology and analysis.
Powered by 


downloads
Tags:
More
Credit Photo
If you would like to credit the Photo, here are some ways you can do so
Text Link
photo Link
<span class="text-link">
<span>
<a target="_blank" href=https://pikwizard.com/photo/global-financial-data-visualization-with-graphs/43f60a7b8bd6e0f957beb12f7d35950a/>PikWizard</a>
</span>
</span>
<span class="image-link">
<span
style="margin: 0 0 20px 0; display: inline-block; vertical-align: middle; width: 100%;"
>
<a
target="_blank"
href="https://pikwizard.com/photo/global-financial-data-visualization-with-graphs/43f60a7b8bd6e0f957beb12f7d35950a/"
style="text-decoration: none; font-size: 10px; margin: 0;"
>
<img src="https://pikwizard.com/pw/medium/43f60a7b8bd6e0f957beb12f7d35950a.jpg" style="margin: 0; width: 100%;" alt="" />
<p style="font-size: 12px; margin: 0;">PikWizard</p>
</a>
</span>
</span>
Free (free of charge)
Free for personal and commercial use.
Author: Authentic Images
Similar Free Stock Images

Premium


Premium

Premium

Premium


Premium


Premium


Premium


Premium

Premium

Premium


Premium


Premium


Premium


Premium


Premium

Premium

Premium


Premium


Premium


Premium


Premium


Premium


Premium


Premium


Premium

Explore More Free Stock Images