
- Home >
- Stock Photos >
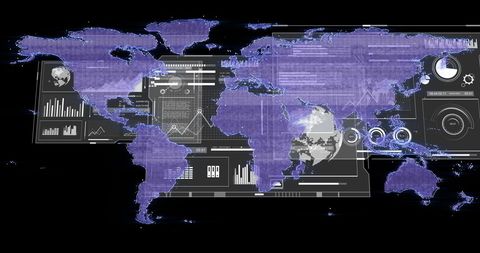
- Global Financial Data Visualization with Interactive Charts
Global Financial Data Visualization with Interactive Charts Image

The image features financial data integrated over a world map, showcasing global business and economic trends. Interactive charts and graphs highlight information analysis and data processing capabilities at an international scope. This type of visual representation is ideal for business presentations, reports, and educational materials focusing on finance, economics, or global markets.
Powered by 


downloads
Tags:
More
Credit Photo
If you would like to credit the Photo, here are some ways you can do so
Text Link
photo Link
<span class="text-link">
<span>
<a target="_blank" href=https://pikwizard.com/photo/global-financial-data-visualization-with-interactive-charts/1db40f6228bace78c58e7979d9b02e6e/>PikWizard</a>
</span>
</span>
<span class="image-link">
<span
style="margin: 0 0 20px 0; display: inline-block; vertical-align: middle; width: 100%;"
>
<a
target="_blank"
href="https://pikwizard.com/photo/global-financial-data-visualization-with-interactive-charts/1db40f6228bace78c58e7979d9b02e6e/"
style="text-decoration: none; font-size: 10px; margin: 0;"
>
<img src="https://pikwizard.com/pw/medium/1db40f6228bace78c58e7979d9b02e6e.jpg" style="margin: 0; width: 100%;" alt="" />
<p style="font-size: 12px; margin: 0;">PikWizard</p>
</a>
</span>
</span>
Free (free of charge)
Free for personal and commercial use.
Author: People Creations
Similar Free Stock Images

Premium


Premium


Premium

Premium


Premium


Premium


Premium


Premium


Premium


Premium


Premium


Premium


Premium


Premium


Premium


Premium


Premium


Premium


Premium


Premium


Premium


Premium


Premium


Premium


Premium

Explore More Free Stock Images